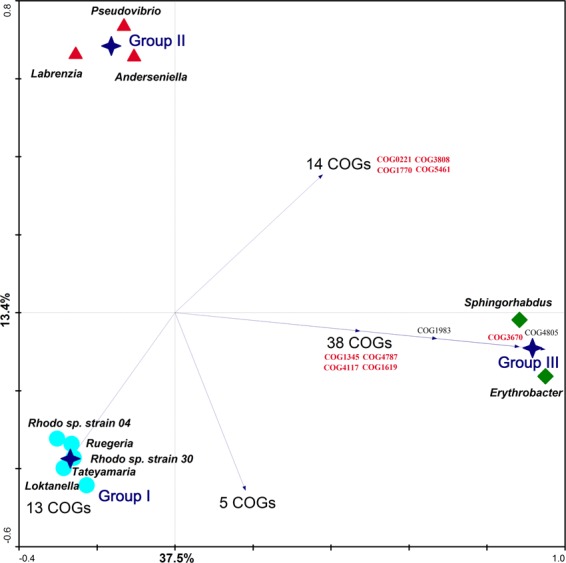
Figure 3.

Functional ordination of Alphaproteobacteria genomes via Redundancy Analysis (RDA). Hellinger-transformed COG profiles were used as genome descriptors. Blue stars represent the centroid positions of functional genome Groups I, II and III, found to contribute significantly to variations in COG profiles as determined by Monte-Carlo permutation tests. Values displayed on the diagram axes refer to the percentage variation in the total dataset explained by the respective axis. Samples (i.e., genomes) are plotted in the ordination diagram in accordance with Euclidean distances calculated for each pair of genomes based on their COG relative abundance profiles. Arrows represent COGs displaying positive correlation fit > 99% with their corresponding genome group(s), all of which are listed in Supplementary Table S6. COGs highlighted in red have been approached more thoroughly in this study. Note the closer functional similarity between members of the “Stappia group” (Pseudovibrio and Labrenzia, formally belonging to the family Rhodobacteraceae in the order Rhodobacterales) to the genus Anderseniella (order Rhizobiales) (Group III) than to other genera of the Rhodobacteraceae family (Group I).
