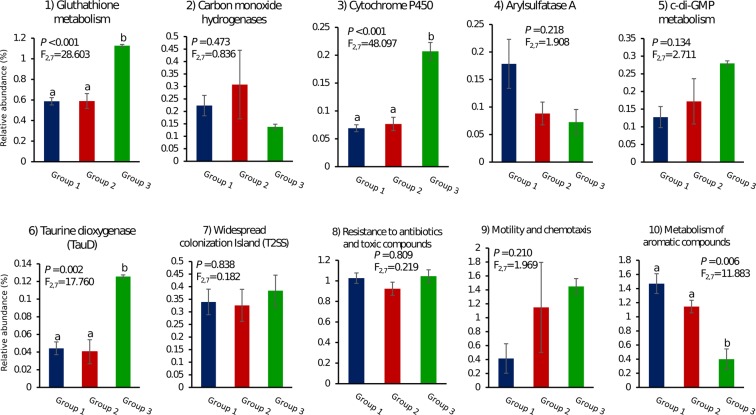
Figure 5.
Relative abundance of ecologically informative genomic signatures across functional genome Groups I, II and III (Fig. 3). Columns represent average proportions (%) of genomic features in each functional group ± standard errors. The different letters above error bars indicate significant differences (P < 0.05) between groups. Respective F and P values are presented in the graphs. All data were of equal variance and all data except c-di-GMP-metabolism (5) and widespread colonization island (7) were normally distributed. COG annotations were used to infer the relative abundance of genomic features (1) to (7), determined by the ratio “total number of CDSs in the respective COG entry(ies)/total number of CDSs assigned to COGs” in each genome group. RAST annotations were used to infer the relative abundance of genomic features (8) to (10) (RAST subsystems), determined by the ratio “total number of CDSs in subsystem/total number of CDSs” in each functional group. Functions enriched (1–4, 6, 8, and 10) and depleted (5, 7 and 9) in the S. officinalis endosymbiotic consortium (Karimi et al., 2017), or in sponge-specific and uncultured Alphaproteobacteria lineages (Karimi et al., 2018), could be found across the genomes analysed in this study.

