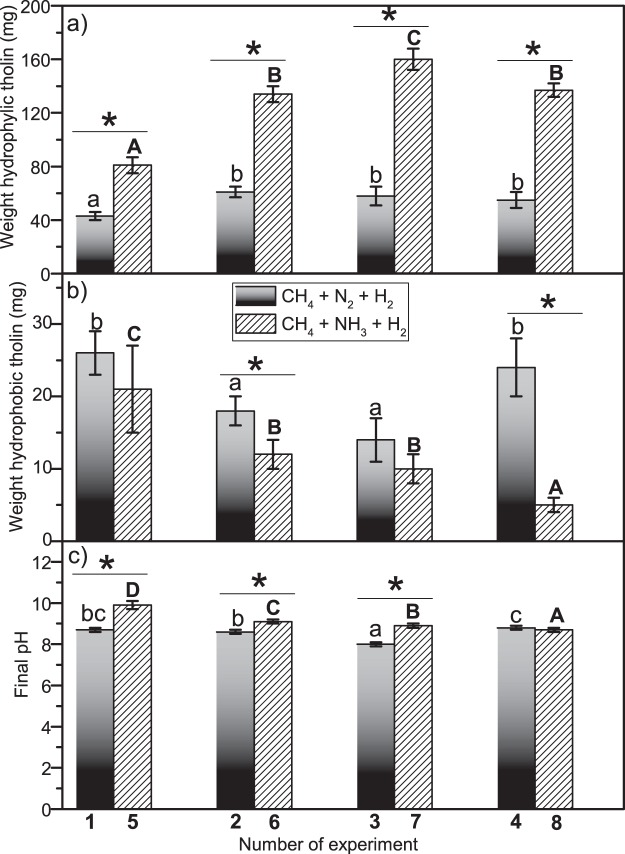
Figure 1.
Histograms showing the effects of the aqueous aerosols and initial pH on (a) the final weight of the hydrophilic tholins (soluble organic matter); (b) the final weight of the hydrophobic tholins (insoluble organic matter); and (c) the final pH of the crude reactions. The number shown on the x-axis corresponds to the experiment number indicated in Table 1. Statistical test: pairs test based on the confidence interval comparison (α = 0.047). *Indicates differences within groups, and letters indicate differences between groups (CH4 + N2 + H2 group = lowercase letters; CH4 + NH3 + H2 group = capital letters). The average values and the standard deviations were calculated from the results of at least five experiments.

