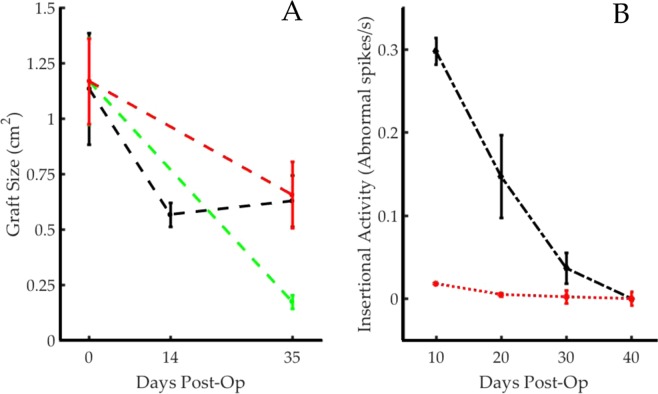
Figure 2.
Reinnervation and Atrophy Trends. (A) Average graft size (n = 5 each) and standard deviation at each surgical step or final testing session is shown; dual-stage AMIs (black) underwent similar rates of atrophy to single-stage AMIs (red) but were significantly less atrophied when compared to the separated grafts (green). (B) Insertional needle EMG activity levels in the dual-stage AMI (black) are compared to those in the contralateral gastrocnemius (red) (n = 5) and demonstrate reinnervation of the grafts over the course of 40 days.

