Figure 3.
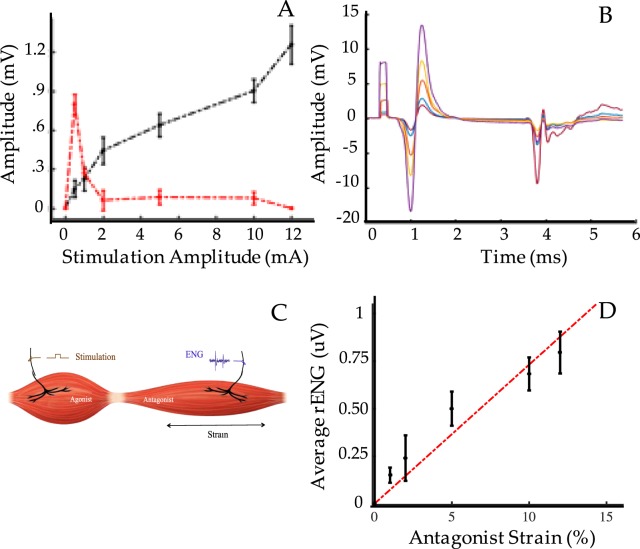
M-wave and H-wave Trends. (A) Shown are average m-wave (black) and h-wave (red) amplitudes at each stimulation amplitude (0.5, 1, 2, 5, 10 mA). (B) Shown are average EMG amplitudes of m and h waves in response to 100 us, squarewave stimulation pulses on the tibial nerve (n = 150). As m-wave amplitude increases, h-wave amplitude decreases. (C) Electrophysiological set up to measure afferent signals generated from the antagonist due to agonist contraction. A stimulation pulse is applied to the agonist nerve while measuring ENG from the antagonist nerve to survey for afferent feedback signals. (D) Graded afferent signals correlated linearly with antagonist strain demonstrating that the agonist and antagonist grafts performed proportionally coupled excursion and appropriate mechanotransduction.

