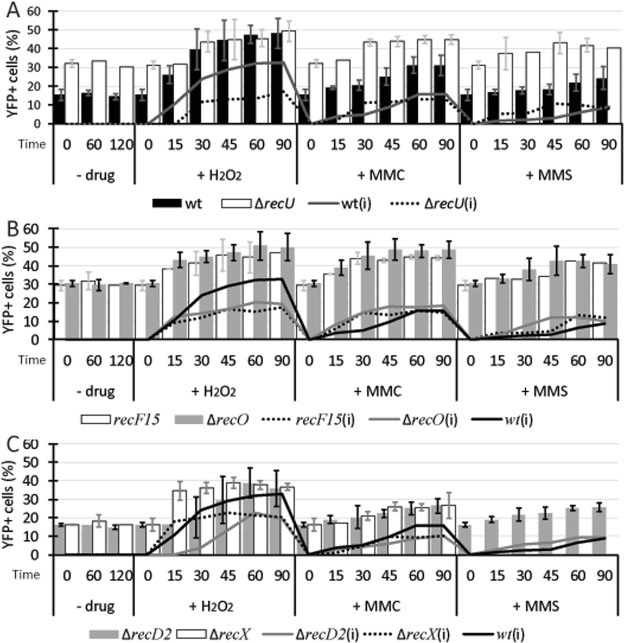
Figure 2.
Epifluorescence for RarA-YFP in wild type cells and different recombination deficient backgrounds after DNA damage. (A–C) Percentage of cells that contains foci in exponential growth, and after addition of H2O2 (1 mM), MMC (50 ng/ml) or MMS (5 mM) for 60 minutes, in wild type and ∆recU (A), ∆recO and recF15 (B), ∆recD2 and ∆recX (C) backgrounds. Lines correspond to the increase of YFP+ cells considering entry into exponential growth (OD600 = ~0.3) as time 0. Error bars represent the standard deviation of at least three independent experiments.

