Fig. 2.
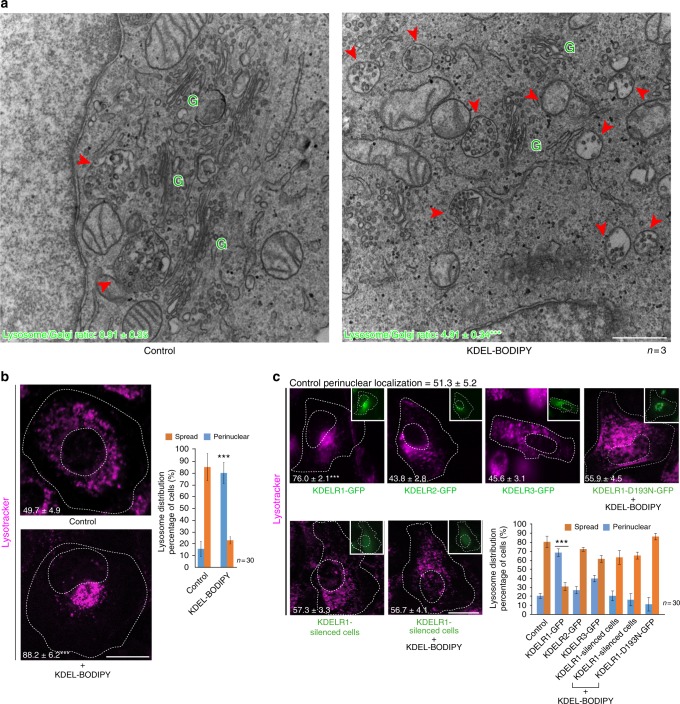
Lysosome repositioning is dependent on the KDELR1 isoform. a To activate KDELR, HeLa cells were incubated for 30 min with 1 µM KDEL-BODIPY peptide. Cells were fixed with glutaraldehyde and processed for electron microscopy analysis. The ratio of lysosomes (red arrowheads) with respect to Golgi stacks (green Gs) was calculated as described in Methods, and the values are indicated at the bottom of each image (three independent experiments). Scale bar, 500 nm. b HeLa cells treated as in a were stained with DeepRed-Lysotracker, and its radial integrated fluorescence intensity was used to quantify the distribution of lysosomes as described in Methods. The graph shows the percentage of cells depicting cytoplasmically spread or perinuclear lysosome distribution. The perinuclear distribution of lysosomes was quantified, and the values are indicated at the bottom of each image (n = 30 cells). Scale bar, 10 µm. c HeLa cells were transfected (insets) to overexpress either of the indicated green fluorescent protein (GFP)-tagged KDELR isoform or GFP-tagged signalling-defective KDELR1-D193N in the presence of KDEL-BODIPY, or with a short hairpin RNA (shRNA) to silence KDELR1 expression in the absence or presence of KDEL-BODIPY. Lysosomes were stained and their distribution quantified as indicated in b. The graph shows the percentage of cells depicting cytoplasmically spread or perinuclear lysosome distribution. The perinuclear distribution of lysosomes was quantified, and the values are indicated at the bottom of each image (n = 30 cells). Scale bar, 10 µm. Data are means ± SEM. ***p < 0.001 (Student’s t tests). All t tests were conducted comparing to control cells

