Fig. 3.
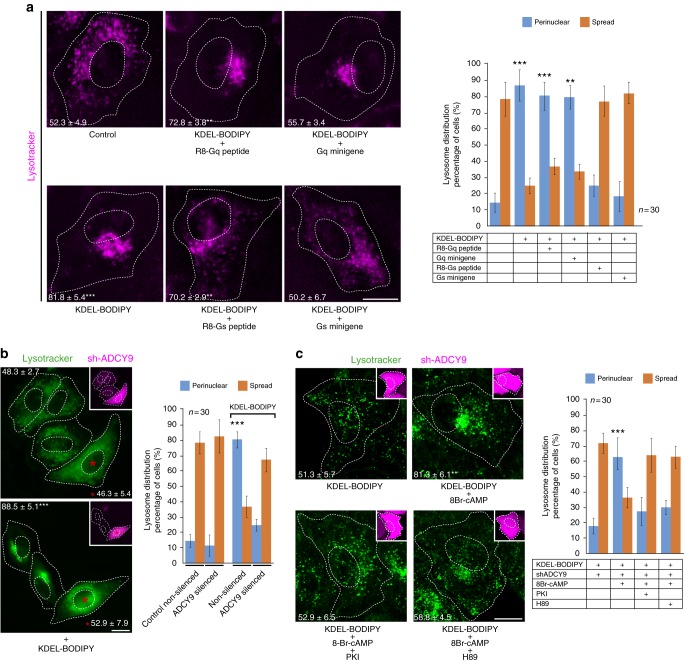
The KDELR-dependent cAMP/PKA signalling pathway regulates lysosome repositioning. a HeLa cells were left untreated (Control) or incubated for 15 min at 37 °C with 1 µM KDEL-BODIPY peptide, to activate KDELR, in the absence (KDEL-BODIPY) or presence of either 10 µM R8-Gq peptide (KDEL-BODIPY + R8-Gq peptide) or 10 µM R8-Gs peptide (R8-Gs peptide), or in conjunction to transfection for the expression of a Gq minigene (KDEL-BODIPY + Gq minigene) or a Gs minigene (KDEL-BODIPY + Gs minigene). Cells were stained with DeepRed-Lysotracker, and its radial integrated fluorescence intensity was used to quantify the distribution of lysosomes as described in Methods. The graph shows the percentage of cells depicting cytoplasmically spread or perinuclear lysosome distribution. The perinuclear distribution of lysosomes was quantified, and the values are indicated at the bottom of each image (n = 30 cells). b HeLa cells stably transfected with sh-ADCY9 (insets; red fluorescent protein (RFP)-positive cells; red asterisks) were incubated with Lysotracker green and then either left untreated (Control) or treated with KDEL-BODIPY peptide as in a. Lysosomes distribution was quantified as indicated in a. The graph shows the percentage of cells depicting cytoplasmically spread or perinuclear lysosome distribution. The perinuclear distribution of lysosomes was quantified, and the values are indicated at the bottom of each image (n = 30 cells). c ADCY9-silenced HeLa cells (insets; RFP-positive cells) were incubated with KDEL-BODIPY alone as in a or co-incubated with only the non-hydrolysable cAMP analogue 8-Br-cAMP (100 µM) or with 8-Br-cAMP in conjunction to either of the PKA inhibitors PKI (50 µM) or H89 (30 µM). Lysosome distribution was quantified as indicated in a. The graph shows the percentage of cells depicting cytoplasmically spread or perinuclear lysosome distribution. The perinuclear distribution of lysosomes was quantified, and the values are indicated at the bottom of each image (n = 30 cells). Scale bar, 10 µm. Data are means ± SEM. ***p < 0.001 (Student’s t tests). All t tests were conducted comparing to control cells

