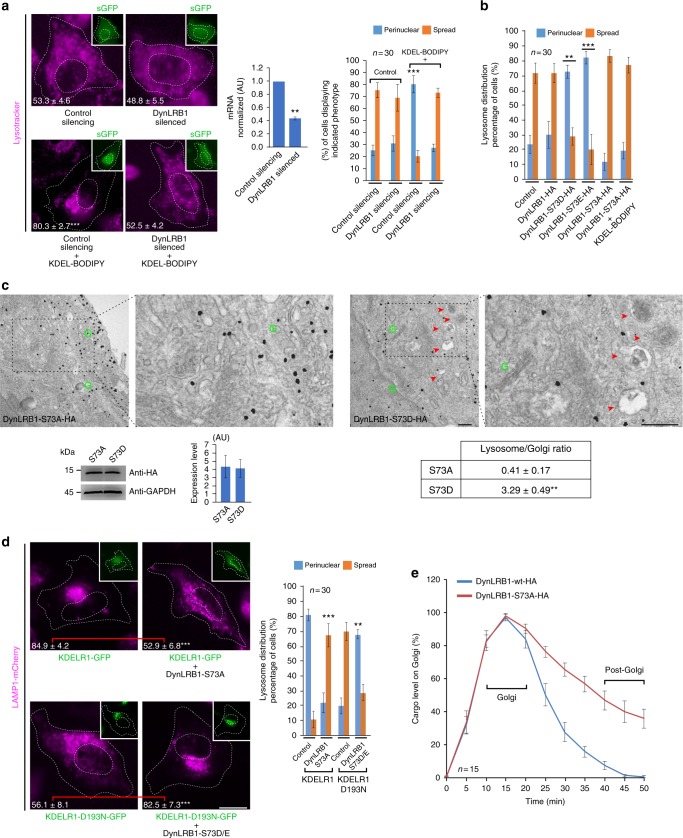
Fig. 4.
LRB1 dynein light chain drives the lysosome repositioning that is necessary to sustain secretion. a HeLa cells subjected either to control silencing or DynLRB1 silencing (insets; green fluorescent protein (GFP)) were left untreated or incubated for 15 min with 1 µM KDEL-BODIPY peptide to induce lysosome repositioning. Silencing was controlled by determining the messenger RNA (mRNA) level of DynLRB1 (first graph, n = 3 independent experiments). Alternatively, cells were stained with DeepRed-Lysotracker, and its radial integrated fluorescence intensity was used to quantify the distribution of lysosomes as described in Methods. The percentage of cells depicting cytoplasmically spread or perinuclear lysosome distribution was calculated (n = 30 cells). The perinuclear distribution of lysosomes was quantified, and the values are indicated at the bottom of each image (n = 30 cells). Scale bar, 10 µm. b HeLa cells not transfected (Control) or expressing either of the indicated HA-tagged variants of DynLRB1 were either left untreated or incubated with KDEL-BODIPY. Lysosomes were stained, and their distribution quantified as indicated in a, (n = 30 cells). c HeLa cells were transfected to express either of the indicated hemagglutinin (HA)-tagged variants of DynLRB1 and processed for immunogold labelling (10 nm) against the HA-tag and subsequent electron microscopy analysis. DynLRB1 expression was assessed by western blotting using anti-HA or anti-glyceraldehyde 3-phosphate dehydrogenase (GAPDH) antibodies, and the corresponding quantification is shown in a bar graph (data are means ± SEM). The ratio of lysosomes (red arrowheads) with respect to Golgi stacks (green Gs) was calculated as described in Methods, and the values are indicated in the table depicted in the fourth image (n = 3 independent experiments). The second and fourth images correspond to a two-fold magnification of the indicated regions of the first and third images, respectively. d Cells expressing LAMP1-mcherry and either KDELR1-GFP or KDELR-D193N-GFP were left without further treatment (Control) or transfected to co-express either of the indicated HA-tagged variants of DynLRB1. Lysosomes were stained, and their distribution quantified as indicated in a, (n = 30 cells). Scale bar, 10 µm. e HeLa cells expressing human growth hormone fused to the polymerization/depolymerization FM domain (hGH-GFP-FM) and co-expressing either DynLRB1-wt-HA (Control) or DynLRB1-S73A-HA were subjected to the ER-to-Golgi transport assay, and images were acquired for 50 min at 5 min interval. The level of cargo on the Golgi complex was quantified (n = 15 cells). Data are means ± SEM. **p < 0.01; ***p < 0.001 (Student’s t tests). All t tests were conducted comparing to control cells. wt Wild type

