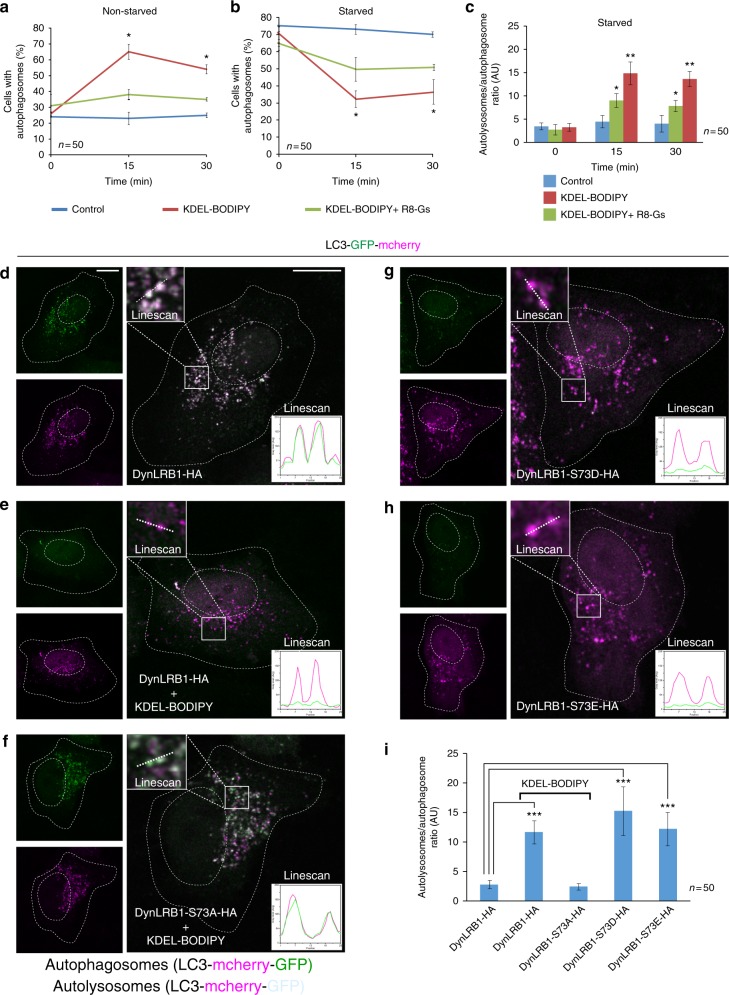
Fig. 5.
The fusion of autophagosomes and lysosomes is regulated by KDELR and DynLRB1. a H4 cells transfected to express the pH-sensitive autophagy flux marker LC3 (mcherry-GFP-LC3) were left untreated (Control) or incubated for 15 or 30 min at 37 °C with 1 µM KDEL-BODIPY peptide alone, or in combination with 10 µM R8-Gs peptide. The graph depicts the quantification of cells with autophagosomes that were regarded as puncta showing mcherry and green fluorescent protein (GFP) fluorescence (n = 50 cells). b H4 cells transfected as in a were subjected to nutrient starvation for 1 h to induce autophagosome formation, and then incubated with cell-permeable peptides as in a. The graph depicts quantification of cells (n = 50 cells) with autophagosomes as indicated in a. c Quantification of the ratio between autolysosomes and autophagosomes in cells treated as indicated in b. Autolysosome/autophagosome ratio was calculated by automatic counting of red (mcherry, pH-insensitive) and green (GFP, pH-sensitive) positive puncta (n = 50 cells). d–h HeLa cells were co-transfected to express mcherry-GFP-LC3 and either of the indicated DynLRB1-HA (hemagglutinin) variants, and either left untreated (d, g and h) or incubated for 30 min with 1 µM KDEL-BODIPY (e and f). Insets show linescans (25-length × 4-width pixels) of representative regions depicting the presence of red and green fluorescent emission profiles of autophagic puncta. Red and green emission identifies puncta as autophagosomes, and lack of green emission identifies puncta as autolysosomes (n = 3 independent experiments). Scale bars, 10 µm. i Quantification of the ratio between autolysosomes and autophagosomes as indicated in c in cells (n = 50 cells) treated as indicated in d–h. Data are means ± SEM. *p < 0.05; ***p < 0.001 (Student’s t tests). All t tests were conducted comparing to control cells

