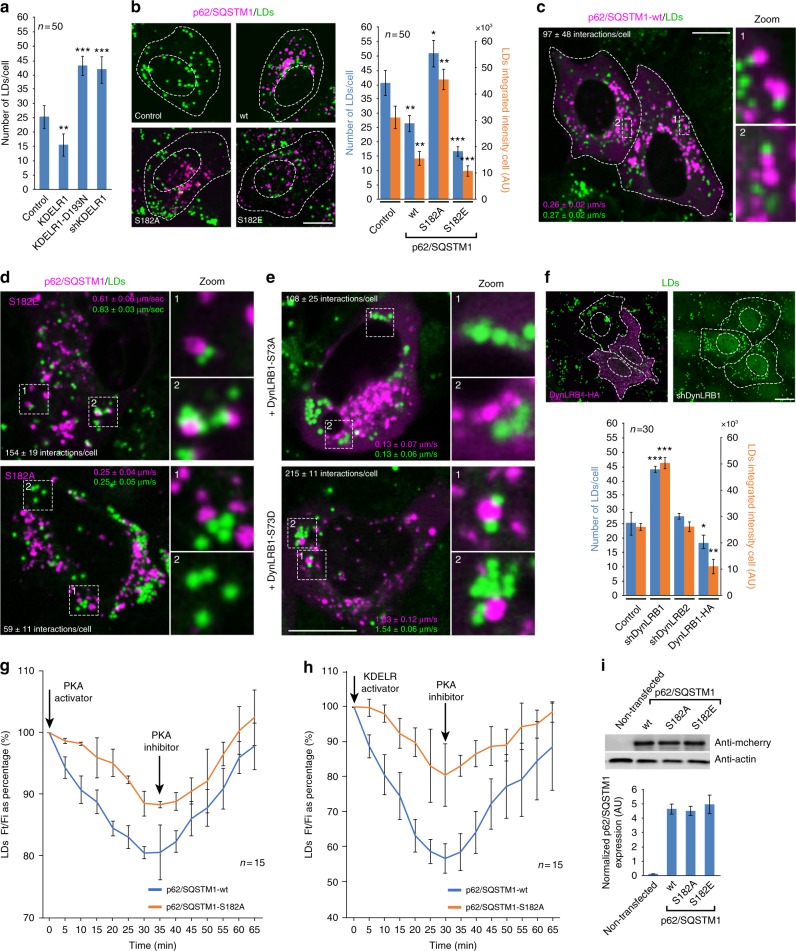
Fig. 8.
KDELR1 modulate lipid droplet turnover during activation of lysosome repositioning. a HeLa cells untreated (Control) or transfected with KDELR1, KDELR1-D193N or short hairpin RNA (shRNA) against KDELR1 were fixed and lipid droplets (LDs) were stained and a quantitative analysis of the number of LDs was calculated (n = 50 cells). b H4 cells untreated (Control) or transfected to express either of the indicated p62/SQSTM1-mcherry variants and LDs were stained and quantified (n = 50 cells). c H4 cells were transfected to transiently express p62/SQSTM1-mcherry-wt (wild type), followed by LD staining. Live-cell images were acquired, and the number of interactions between LDs and p62/SQSTM1-mcherry-wt puncta and of the joint speeds of movement were calculated as indicated in Methods (n = 3 independent experiments). d H4 cells were transfected to transiently express p62/SQSTM1-mcherry-S182E or p62/SQSTM1-mcherry-S182A, followed by LD staining and live-cell imaging acquisition and analysis (n = 3 independent experiments) as indicated in c. e H4 cells were transfected to transiently co-express p62/SQSTM1-mcherry-wt and either of the indicated hemagglutinin (HA)-tagged DynLRB1 variants, followed by LD staining and live-cell imaging acquisition and analysis as indicated in c. The number of interactions and the joint speeds of movement (n = 3 independent experiments) was calculated. f HeLa cells were transfected either to express DynLRB1-HA-wt (DynLRB1-HA) or with an shRNA against DynLRB1 (shDynLRB1). Cells were fixed and LDs were stained and immunofluorescence to detect DynLRB1-HA-wt. The graph shows the quantification of the number and fluorescence intensity of LDs of cells subjected to the indicated treatments (n = 30 cells). g H4 cells were transiently transfected to express p62/SQSTM1-wt or p62/SQSTM1-S182A and were stained for LDs, and images were acquired every 5 min under PKA activation and subsequent PKA inhibition (n = 15 cells). (h) H4 cells were transiently transfected to express p62/SQSTM1-wt or p62/SQSTM1-S182A and were stained for LDs, with images acquired every 5 min under KDELR activation and subsequent PKA inhibition (n = 15 cells). i H4 cells transfected as in b–h were subjected to sodium dodecyl sulphate-polyacrylamide gel electrophoresis (SDS-PAGE) and western blot against actin (load control) and mCherry (p62/SQSTM1). Normalized mCherry/actin signal is shown on the plot bars (n = 3 independent experiments). Data are means ± SEM. *p < 0.05; **p < 0.01; ***p < 0.001 (Student’s t tests). All t tests were conducted comparing to control cells

