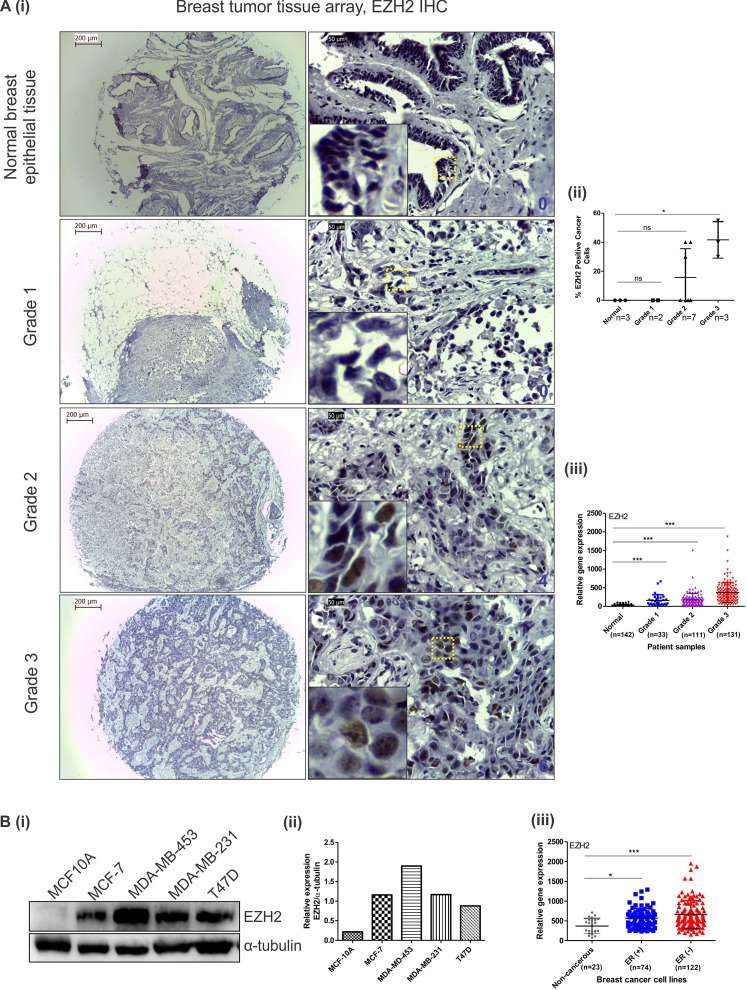
Figure 1.
EZH2 expression increases with increasing tumor grade and is upregulated in breast cancer cell lines. (A) [i] Immunohistochemistry performed in tissue array of different grades of invasive breast tumors show EZH2 expression. Insets show 10 times digitally magnified pictures of images captured with 40X objective. [ii] The scatter plot shows the percent EZH2 positive cancer cells present in different grades of tumor tissues. [iii] Graph displays EZH2 expression in different grades of tumor in comparison to normal breast tissues as observed in MERAV expression database. (B) [i] Western blot displays EZH2 protein expression in breast cancer cell lines along with normal breast epithelial MCF10A cells. [ii] Graph shows normalized expression of EZH2 protein using ImageJ software. [iii] EZH2 expression in ER (+)ve and ER (−)ve breast cancer cells along with non-cancerous breast cells as observed in MERAV expression database is presented in the graph. One way ANOVA was used for statistical analysis. *P < 0.05, ***P < 0.001. Scale bar 200 µm (4X) and 50 µm (40X).

