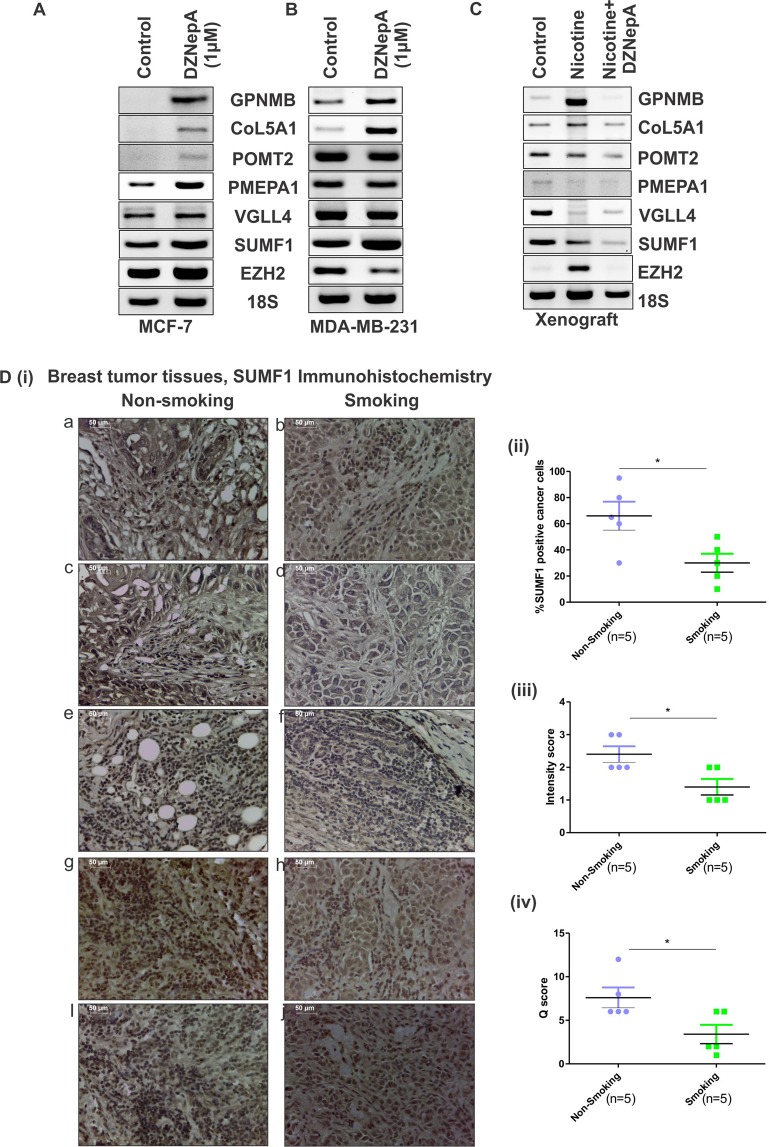
Figure 10.
EZH2 functions through its target genes. (A,B) Diagram shows the mRNA expression of EZH2 and its target genes in control and DZNepA treated MCF-7 and MDA-MB-231 breast cancer cells respectively observed in reverse transcriptase PCR. (C) Reverse transcriptase PCR data shows expression of EZH2 and its target genes in xenograft collected from vehicle, nicotine and nicotine & DZNepA treated mice. (D) [i] Expression of SUMF1 in tissue sections from smoking and non-smoking breast cancer patients as observed in immunohistochemistry. [ii] Scatter plot depicts the percent SUMF1 positive cancer cells in the tissue section from smoking and non-smoking patient samples. [iii] Scatter plot shows the intensity score of SUMF1 expression in two experimental groups. [iv] Graph displays the Q-score of SUMF1 expression in experimental groups. Two tailed paired Student t-test was used for statistical analysis *P < 0.05.

