Figure 3.
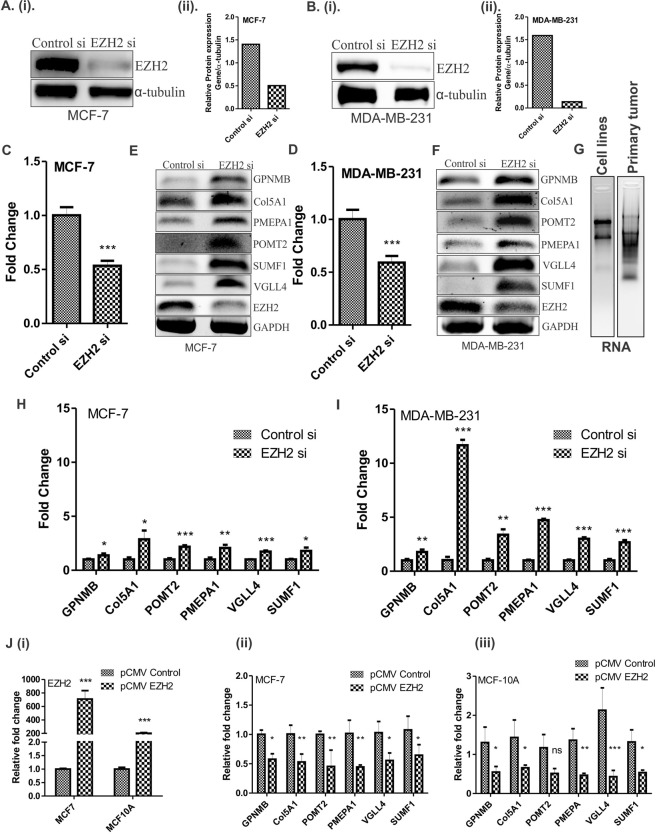
Expression of identified target genes corresponds to EZH2 expression in breast cancer cells. (A) [i] and (B) [i] Immunoblot depicts the level of EZH2 knockdown in MCF-7 and MDA-MB-231 cells respectively. (A) [ii] and (B) [ii] Graphs display respective ImageJ quantification of EZH2 protein in MCF-7 and MDA-MB-231 upon EZH2si transfection. (C,D) Relative fold change of EZH2 expression in controlsi and EZH2si transfected MCF-7 and MDA-MB-231 cells respectively is displayed in the graphs. (E,F) Agarose gel picture shows the expression of EZH2 and its target genes in MCF-7 and MDA-MB-231 respectively upon EZH2 knockdown using semi-quantitative PCR. (G) Figure shows the representative image for quality of RNA isolated from breast cancer cell lines and primary breast tumors. (H,I) qRT-PCR data displayed in the graph shows real time expression of identified target genes upon EZH2 knockdown in MCF-7 and MDA-MB-231 respectively. (J) [i] Relative fold change in EZH2 expression upon transfection of its over-expression construct is evident from the graph. [ii] and [iii] Graph depicts the mRNA expression of EZH2 target genes upon ectopic expression of EZH2 in MCF-7 and MCF-10A respectively. Two tailed paired Student t-test and one way ANOVA was used for statistical analysis for experiments done in triplicate *P < 0.05, **P < 0.005, ***P < 0.001.

