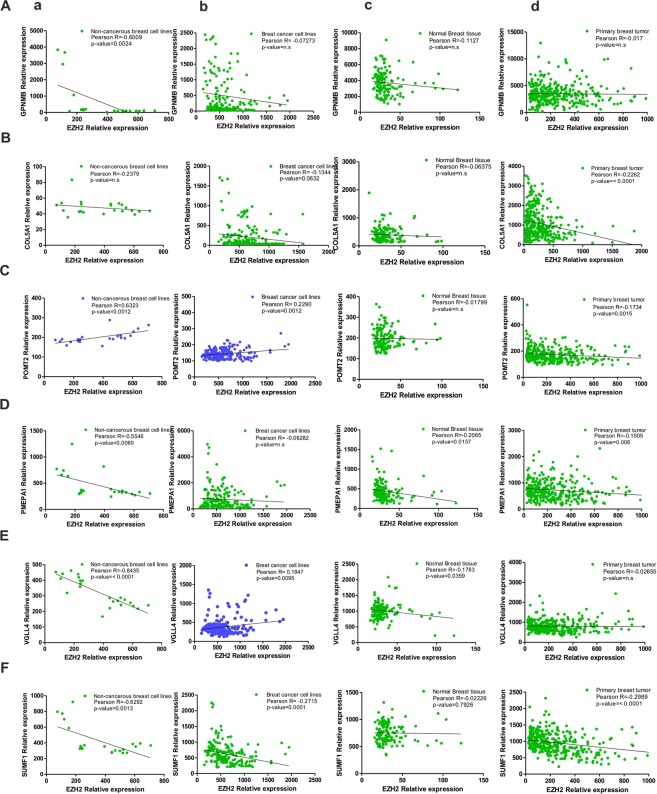
Figure 5.
EZH2 and target gene correlation as observed in MERAV database. (A–F) Graphs show respective correlation of expression of GPNMB, COL5A1, POMT2, PMEPA1, VGLL4 and SUMF1 with EZH2 expression in non-cancerous breast cell lines (a), breast cancerous cell lines (b), normal breast tissues (c) and in primary breast tumors (d). Pearson correlation coefficient between the variables was calculated with the help of the software GraphPad Prism v5.01.

