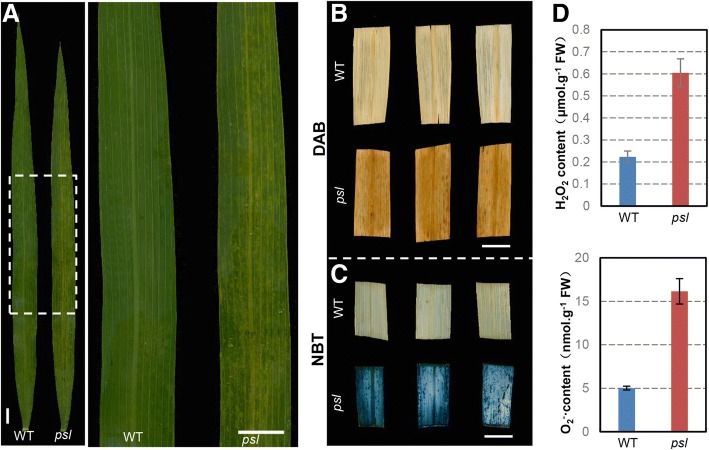
Fig. 2.
Comparison of ROS levels between wild-type and psl plants. a phenotype of flag leaves two days after flowering. b Leaves stained with 3,3′-diaminobenzidine (DAB), showing the H2O2 levels in wild-type (WT) and psl plants. c Leaves stained with nitroblue tetrazolium (NBT), showing O2− in WT and psl plants. d ROS (H2O2 and O2−) content in psl mutant. Scale bar, 1 cm

