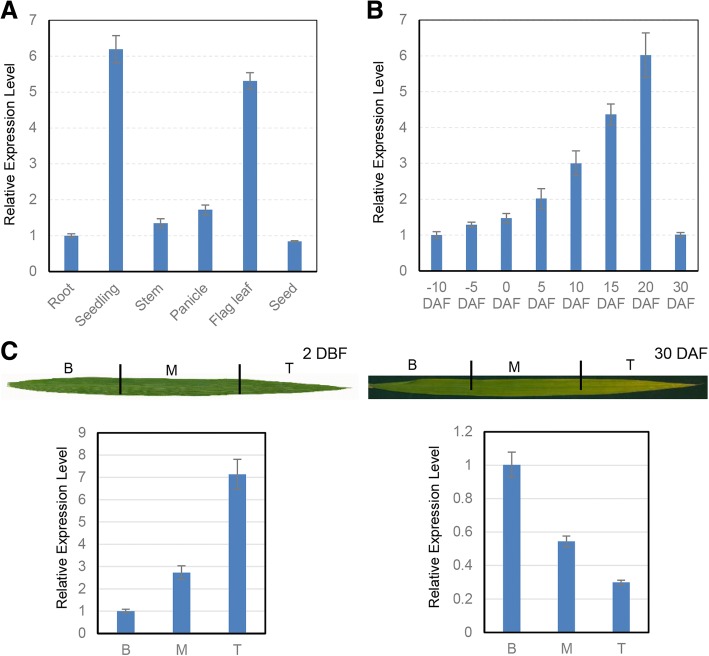
Fig. 5.
Analysis of OsPSL expression. a Quantitative RT-PCR (qRT-PCR) analysis of OsPSL expression in various organs, including root and young seedling at the two-leaf stage, stem, panicle and flag leaf at booting stage, and seed 10 days after flowering (DAF). b Change over time in the OsPSL transcription levels of flag leaves. c OsPAL expression in different parts of the fully expanded flag leaf 2 days before flowering (DBF) and 30 DAF. B, base; M, middle; T, tip

