
Figure 6.
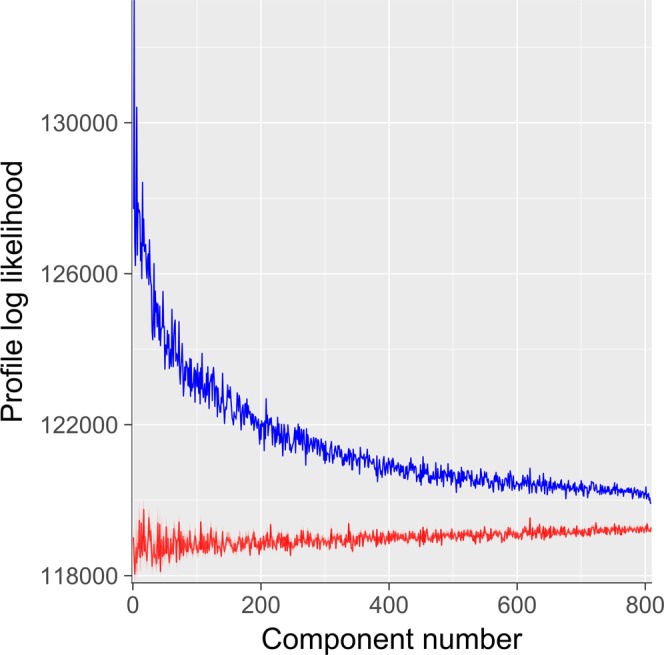
Profile Log-Likelihood of ICN-Based Community Structure in Each Component. This statistic serves to quantify presence of ICN structure in each component using a stochastic block model (SBM) framework. The blue trace is the profile log-likelihood from the SBM according to the community assignments given in Power et al.25. Note that ICN structure is most prominent in early (high variance explained) components. The red trace is the median profile log-likelihood across many random shufflings of the community assignments and serves as a null distribution. Of note, the 95% confidence interval of the null distribution is plotted on the red line, but it is very narrow and not easily visible.