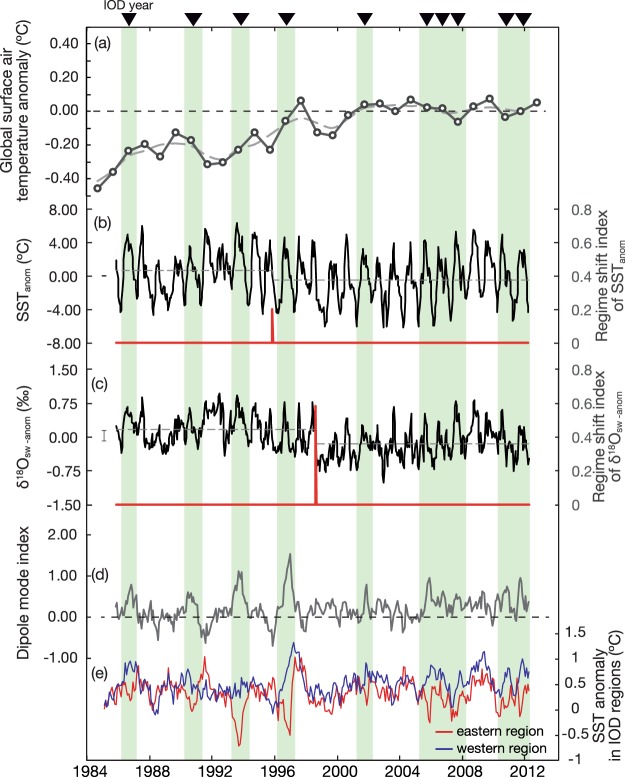
Figure 2.
(a) Global surface air-temperature anomaly (relative to the period of 1998–2013), the. grey line is a 3-years moving average. Data are from the GISS surface temperature analysis (GISTEMP41). Thin dotted line: average global surface air-temperature anomaly during 1998–2013. (b) and (c) show the biweekly SSTanom and δ18Osw-anom in the Gulf of Oman (Black line). The dotted lines show the average values during the pre- and post regime shift. The error bars indicate the uncertainties of biweekly SSTanom and δ18Osw-anom. The regime shift index (red line) for both series was generated from sequential t-test37. (d) Dipole mode index. The green patches and triangles show the timing of the IOD years1. (e) SST anomalies in western and eastern regions of IOD.

