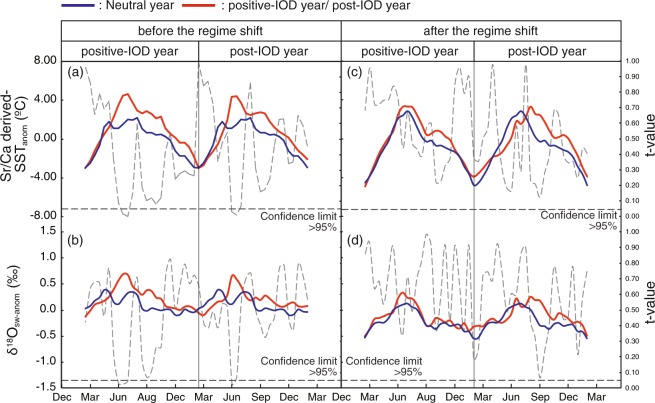
Figure 3.
Seasonal SST anomalies (a) and δ18Osw anomalies (b) during neutral years (blue line) and IOD years or post-IOD years (red line) before the regime shift. Dotted line: t-test results (neutral years vs. IOD years and neutral years vs. the post-IOD years, respectively). During boreal summer of positive and post IOD years, SST anomalies and δ18Osw anomalies are higher than in neutral years. Seasonal SST anomalies (c) and δ18Osw anomalies (d) during neutral years (blue line) and IOD years or post-IOD years (red line) after the regime shift. Dotted line: t-test results (neutral years vs. IOD years and neutral years vs. the post-IOD years, respectively). SST anomalies and δ18Osw anomalies during neutral, positive-IOD and post IOD years are not significantly different.

