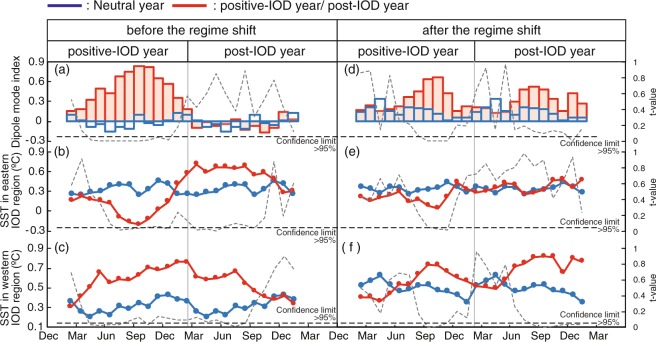
Figure 4.
Seasonal Dipole mode index1 (a) and SST anomalies1 in eastern and western regions (b and c) during neutral years (blue line) and positive-IOD or post-IOD years (red line) before the regime shift. Dotted line: t-test results (neutral years vs. positive-IOD years and neutral years vs. the post-IOD years, respectively). Seasonal Dipole mode index (d) and SST anomalies in eastern and western regions (e and f) during neutral years (blue line) and positive-IOD or post-IOD years (red line) after the regime shift. Dotted line: t-test results (neutral years vs. positive-IOD years and neutral years vs. the post-IOD years, respectively).

