
Figure 5.
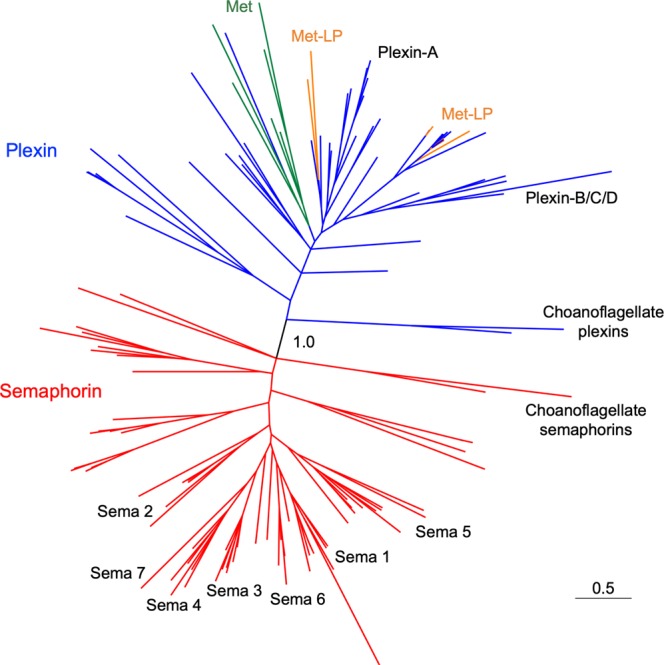
Phylogenetic tree of Sema domain containing proteins. Unrooted representation of a phylogenetic hypothesis inferred by a Bayesian method with the aid of the software MrBayes 3.2.6 implemented on CIPRES63 based on alignment of all Sema plus PSI domain sequences of all proteins described in this study. The “1.0” label in the center is the posterior probability at this branch point calculated by MrBayes. Red lines indicate semaphorins, blue lines plexins, green lines Met RTKs, and orange lines Met-LP RTKs. The plexins and semaphorins of choanoflagellates branch off from the base of the respective plexin and semaphorin clades. Human plexin classes (Plexin-A and Plexin-B/C/D) and bilaterian semaphorin classes (Sema1–7) are indicated to provide reference to the detailed tree representations shown in Figs 6 and 7. Scale bar represents peptide sequence divergence of the sequences.