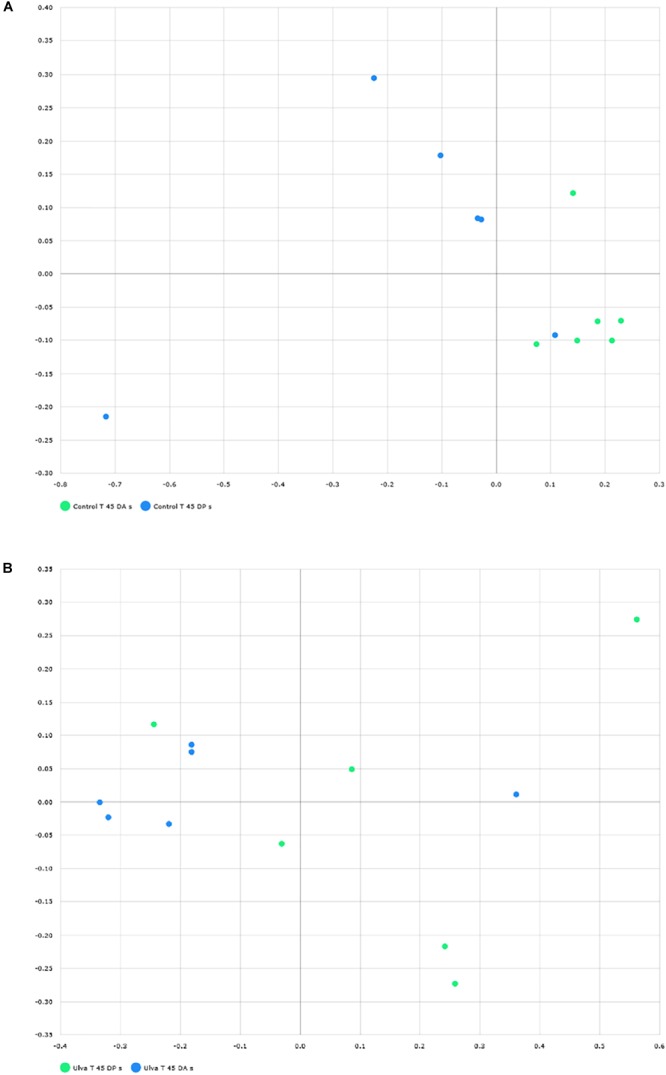
FIGURE 4.

Distribution of GI microbiome samples of S. senegalensis specimens fed control and U. ohnoi (5%) supplemented diet for 45 days. Principal coordinates analysis was applied based on Bray Curtis index. Microbiota in anterior (blue) and posterior (green) sections offish fed with control diet (A) and Ulva diet (B).
