FIGURE 7.

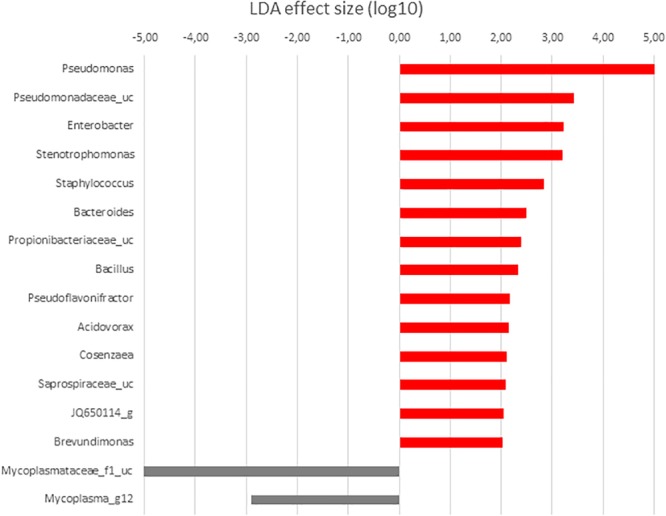
LDA scores for differentially abundant OTUs between anterior (red) and posterior (gray) sections in S. senegalensis specimens fed control diet. p < 0.05.

LDA scores for differentially abundant OTUs between anterior (red) and posterior (gray) sections in S. senegalensis specimens fed control diet. p < 0.05.