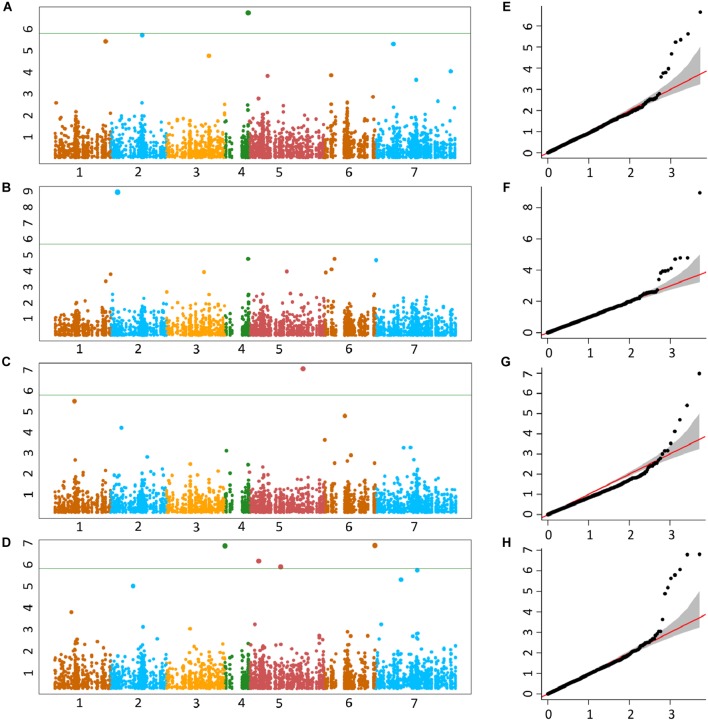
FIGURE 4.
Manhattan plots representing seven chromosomes carrying the significant markers detected by MLM models using BLUP values for grain (A) Fe, (B) Zn, (C) Cu, and (D) Mn. Quantile–quantile (Q-Q) plots for grain Fe, Zn, Cu, and Mn (E–H) showing expected null distribution of p-values, assuming no associations, represented as red solid line; distribution of p-values observed using mixed linear model (MLM) represented as a black dots.

