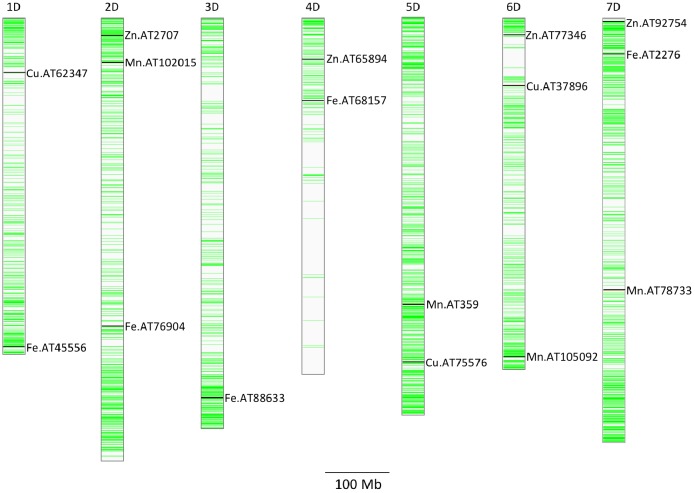
FIGURE 5.
Distribution of GBS SNP markers across the seven Ae. tauschii chromosome arms. The horizontal line color bars indicate the chromosomal position of the markers. The associated markers for micronutrients concentration reported in this study are indicated by black bars. Associated SNPs are indicated by name of the micronutrient followed by AT indicating Ae. tauschii and SNP number.

