
Fig. 1.
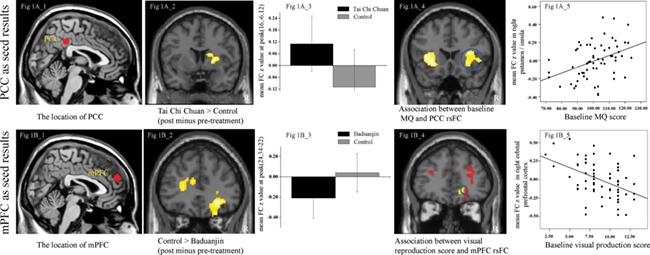
Results of DMN rsFC. Figure 1A_1, location of seed of PCC; Figure 1A_2 and 1A_3, significant rsFC changes between the PCC and right putamen/caudate in the Tai Chi Chuan group compared to the control group; Figure 1A_4, multiple regression analyses showed significant positive correlation between PCC and bilateral anterior insula/putamen/operculum rsFC and baseline MQ score across all subjects adjusted for age; Figure 1A_5, scatter plots indicate the correlation between MQ and mean Z-values in the right putamen/insula cluster (the blue circles of Figure 1A_4) adjusted for age. Figure 1B_1, location of the seed of mPFC; Figure 1B_2 and 1B_3, significant rsFC changes in the Baduanjin group compared to the control group using the mPFC as a seed; Figure 1B_4, the overlapping (the blue circles: right orbital prefrontal gyrus) brain region between significant rsFC changes in the control group compared to the Baduanjin group using the mPFC as a seed (red) and multiple regression analyses showing significant negative correlations between mPFC rsFC and visual reproduction subscores (yellow); Figure 1B_5, scatter plots indicate the correlation between visual reproduction subscores and mean Z-values in the right orbital prefrontal cluster (the blue circles in the Figure 1B_4) adjusted for age; R, right.