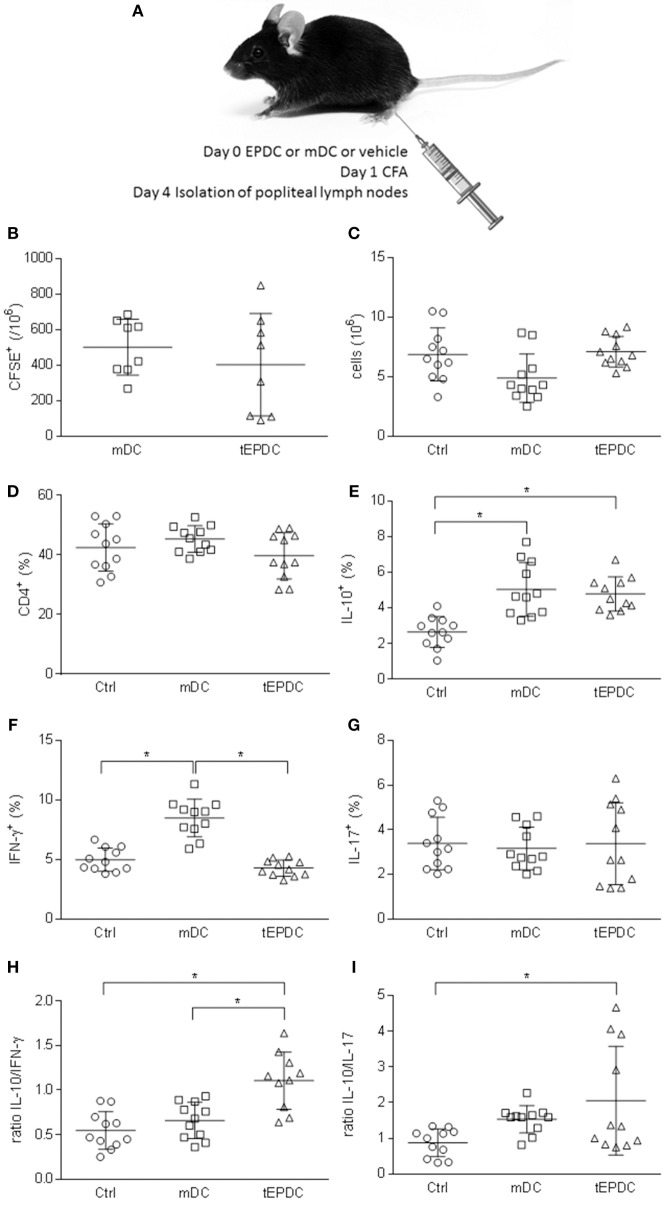
Figure 6.
Effects of murine EP-treated DC on CFA-induced immune response in vivo. Schematic representation of C57BL/6 mice treatment (A). Number of CFSE+ cells (B), total number of cells (C), and proportion of CD4+ cells (D) was determined in popliteal lymph nodes by flow cytometry (B,D) or cell counting (C). Proportion of IL-10+ (E), IFN-γ+ (F), and IL-17+ (G) cells among CD4+ cells was determined by flow cytometry. Ratio of the cytokines expressing CD4+ cells is presented, as well (H,I). Data from three experiments are presented as mean ± SD from a number of mice depicted as the circles, squares, or triangles. *p < 0.05, one way ANOVA followed by Tukey's multiple comparisons test.

