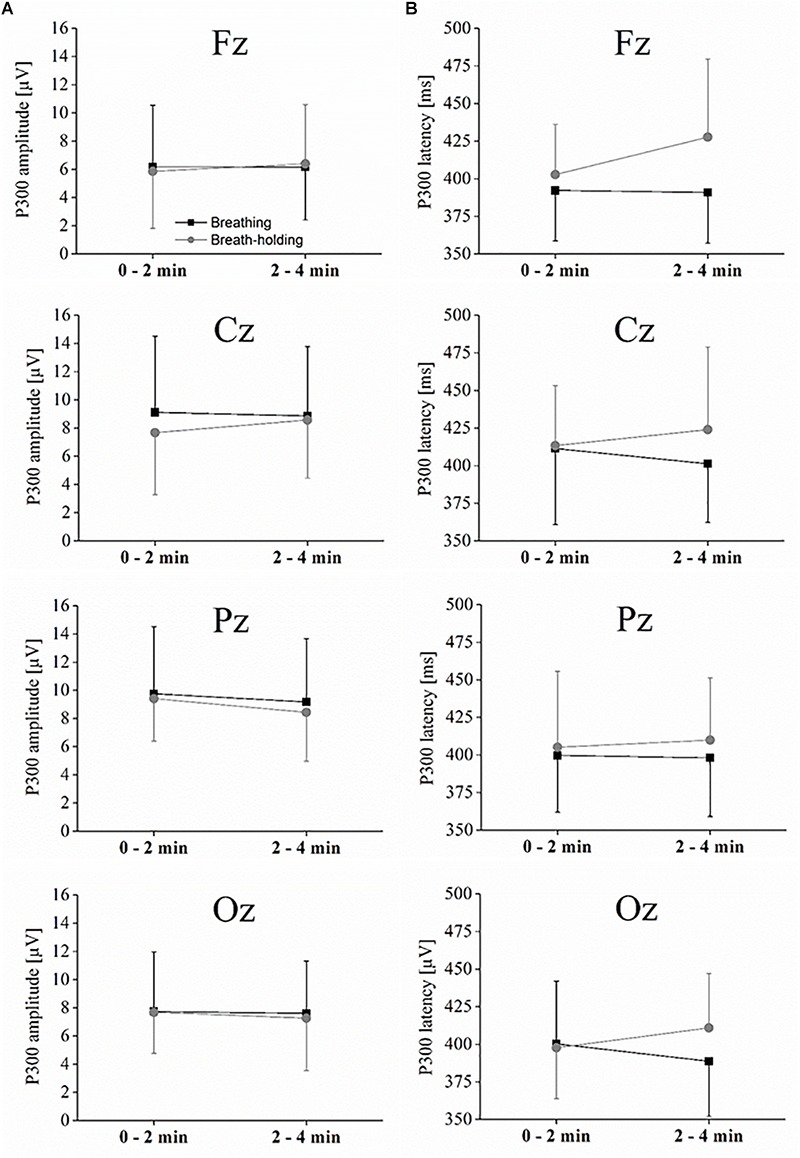
FIGURE 4.

P300 amplitude and latencies. (A) Interaction plot showing the peak amplitude for each condition and phase for the midline electrodes. (B) Interaction plot showing the latency for each condition and phase for the midline electrodes. Statistics are explained in the text. Values represent the arithmetic means and error bars represent the corresponding standard deviations.
