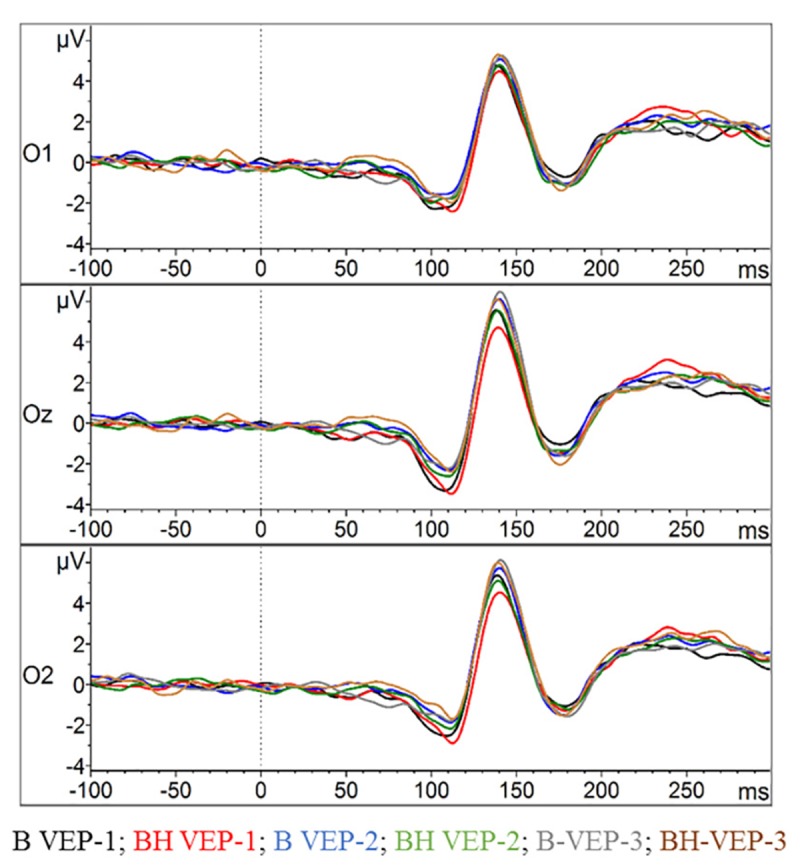
FIGURE 6.

Visual evoked potentials (VEPs) in the checker board task. The amplitudes of the VEPs’ evolution for the occipital lobe at O1, Oz, and O2 (grand average across all participants) are displayed. For each electrode position the two conditions with the three phases of checker board presentation (VEP-1, VEP-2, and VEP-3) are contrasted.
