
Figure 4.
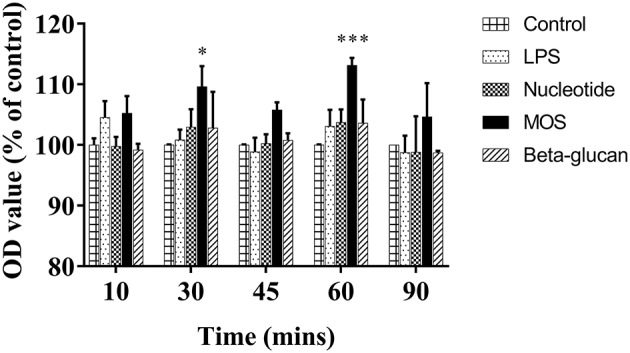
Fluorescent levels in basolateral media after fluorescent albumin exposure into apical chamber in 24-well transwell membrane with RTgutGC cells exposed to LPS and functional ingredients for 6 h. Data are expressed as percent of control cells and represent mean + SEM of two independent experiments with 3 technical insert replicates each. Asterisks denote treatment groups statistically different to the control at the same time point (*P < 0.05, ***P < 0.001).