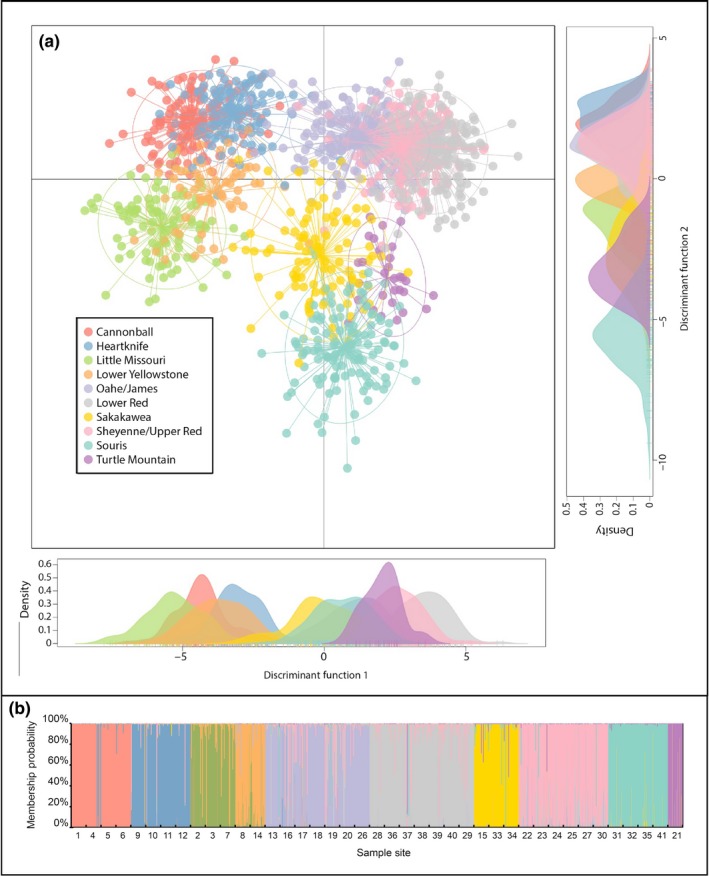
Figure 4.

Results from DAPC population clustering analysis. (a) The first two discriminant functions explained 37.6% and 21.5% of the genetic variation in Rana pipiens from the sampled sites. Each node represents the genotype of an individual frog connected to a centroid of the cluster the frog was assigned to based on K‐means clustering of the DAPC scores. (b) DAPC determined the sampled individuals were optimally clustered into ten groups, with 99.6% of individuals being assigned to one of these clusters with Q > 0.5.
