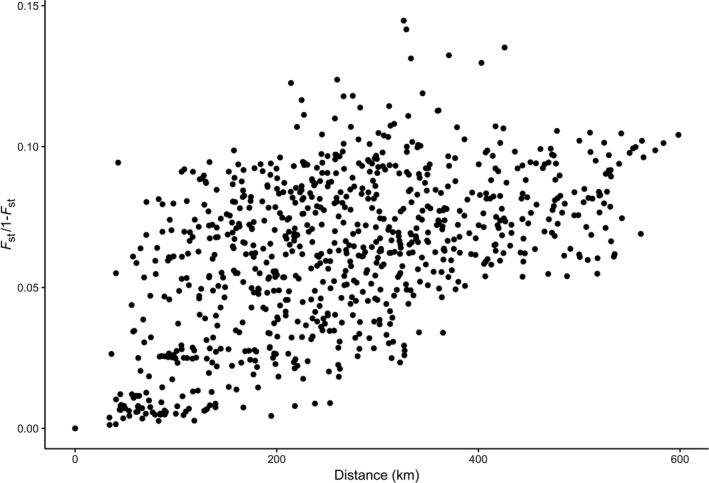
Figure 5.

Correlation between the geographic distance and linearized pairwise F ST for the 41 sampled populations of Rana pipiens in North Dakota. There is a strong signature of isolation by distance with F ST generally increasing with geographic distance
