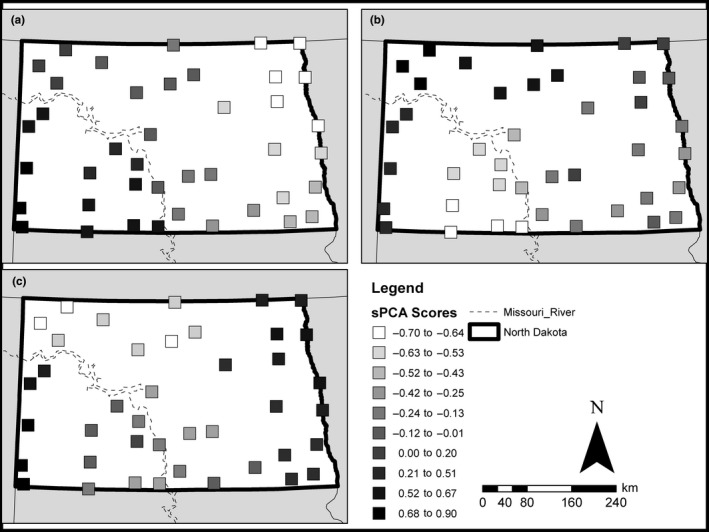
Figure 6.

Results from sPCA landscape analysis showing sPCA scores for the most important sPCA axes describing spatial genetic variation in the 41 sample sites. Scores from the first sPCA axis (a) explained 47.3% of the spatial genetic structure of Rana pipiens in the state of North Dakota indicating a divide between sampled sites on opposite sides of the Missouri River. The second (b) and third (c) sPCA axes explained 23.0% and 14.4% of the genetic structure, respectively, and both depict how the major east and west populations were substructured, with the greatest differentiation in sPCA scores seen between the westernmost populations in the southwest (Lower Yellowstone and Little Missouri basins) and the populations to the east of the Badlands (Heartknife and Cannonball basins), and differentiation seen between populations in the northwest (Sakakawea and Souris basins) from populations in the Red River basin, while populations in the Oahe and James basins show more intermediate genotypes
