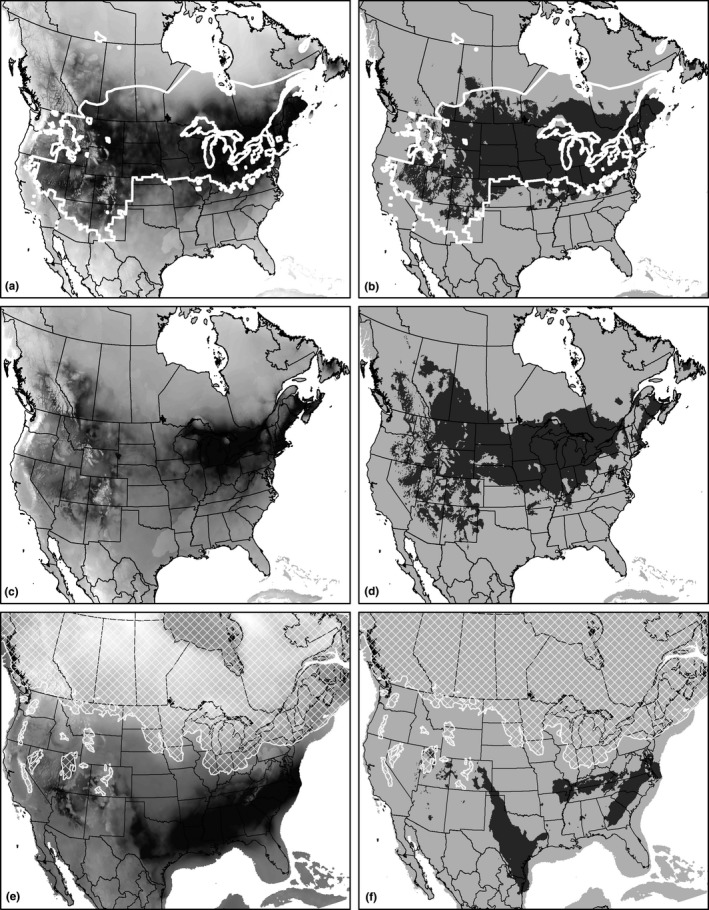
Figure 8.

Maps of species distribution model results showing habitat suitability (darker is more suitable; a, c, e) and expected range (in dark gray; b, d, f). The maps for the present day (a, b) show the actual modern range of Rana pipiens outlined in white. The maps for the Last Glacial Maximum (21 kya; e, f) show the extent of the glaciers at that time in white hatching
