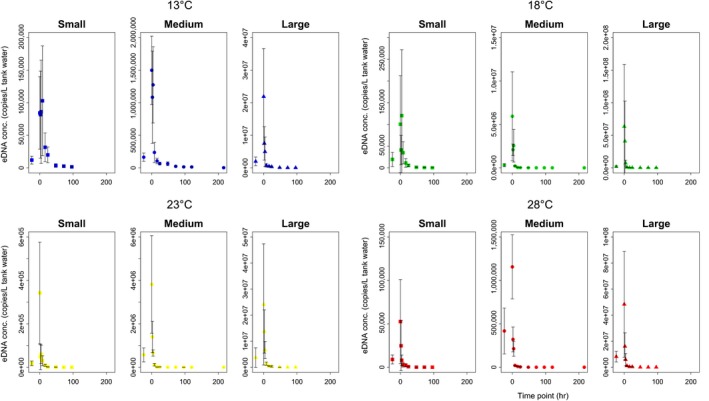
Figure 1.

Decay curves for Japanese Jack Mackerel eDNA in the experimental tanks. Dots show eDNA concentrations per liter of tank water at each time point (Small: square, Medium: circle, Large: triangle; average of four tank replicates, except for the Large at 28°C). Error bars show the standard deviations (SD)
