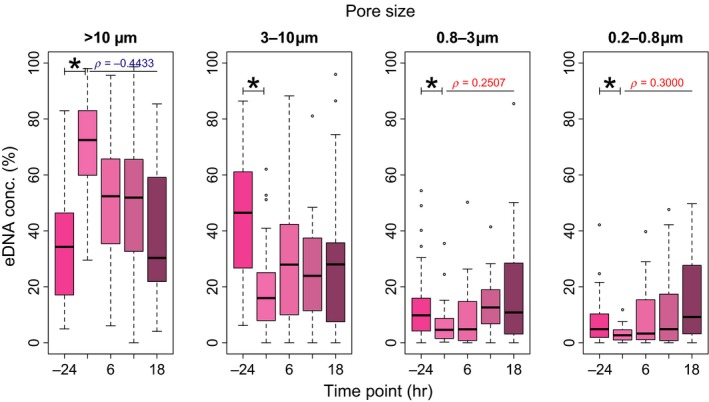
Figure 4.

Temporal dynamics results for eDNA size distribution from time bfr (bright pink) to 18 (dark pink). Sum of the same colors at each pore size gives 100%. Boxplots show the temporal dynamics for the different Japanese Jack Mackerel eDNA percentages at each pore size when all water temperature levels (13°C, 18°C, 23°C, and 28°C) and fish biomass levels (Small, Medium, and Large) are combined. The figure “‐24” below means the time bfr. Stars show significant differences (p < 0.05) in the eDNA concentration proportions between time bfr and 0. Only significant correlations (positive in red and negative in blue) from time 0 to 18 are shown in the boxplots
