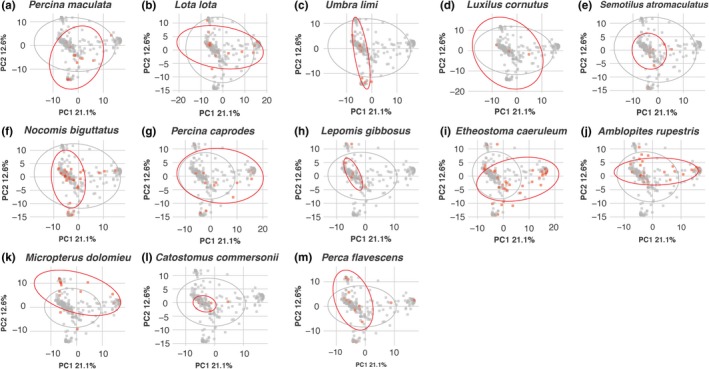
Figure 4.

Principal coordinates analysis (PCoA) of diet compositional variation from all diet samples highlighted by each predator species compared to all other predators. Variation in PC1 is mainly associated with higher prevalence of Ephemeroptera (right) or fishes and rotifers (left) sequences in diet samples. Variation in PC2 is mainly associated with higher prevalence of Otomorpha (top) or Simuliidae (bottom) sequences in diet samples. Each diet sample is represented by a point and color identifying predator species, with the species named in the title above each plot in red and all others in gray
