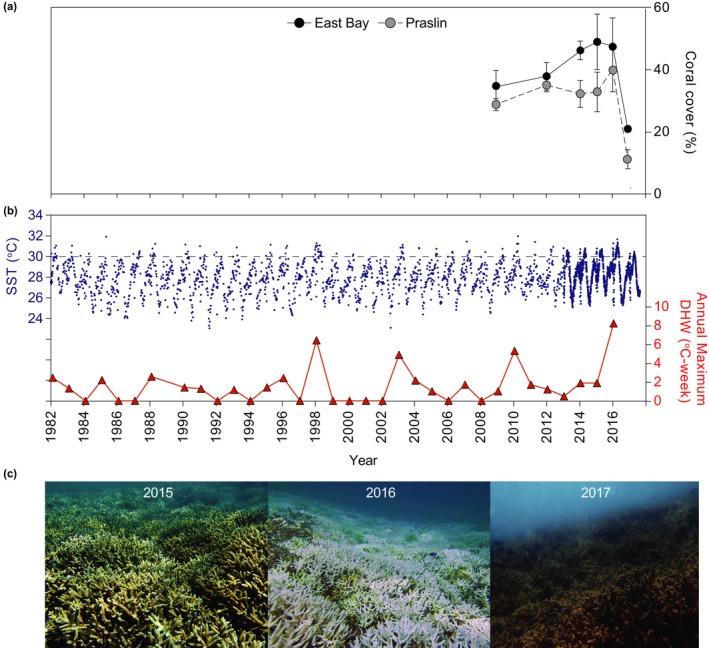
Figure 1.

(a) Coral cover for East Bay (black symbols) and Praslin (light‐gray symbols), (b) sea surface temperatures (SST) between 1982 and 2017 for the Seychelles (dark blue symbols) showing the annual maximum degree heating weeks (DHW; red triangles). Dotted line indicates the average sea surface temperature recorded for Seychelles. Averages ±SE shown for coral cover (n = 3 for East Bay and 6 for Praslin). (c) Photographs showing coral cover and condition between 2015 and 2017 for Acropora sp.
