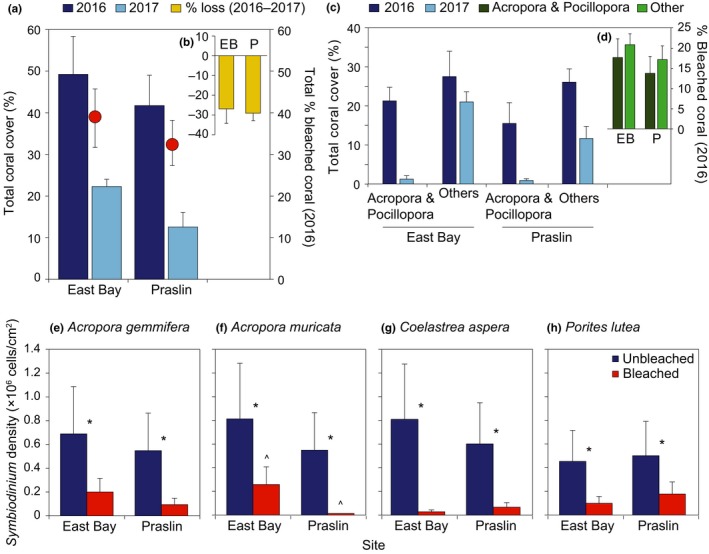
Figure 2.

(a) Total coral cover for 2016 (dark blue bars) and 2017 (light blue bars; left y‐axis) and total percent of bleached coral in 2016 (red symbols; right y‐axis) and (b) total percent of coral lost between 2016 and 2017 (yellow bars) for East Bay (EB) and Praslin (P), (c) total coral cover for Acropora and Pocillopora and Other groups in 2016 (dark blue bars) and 2017 (light blue bars; left y‐axis) and (d) total percent of bleached coral in 2016 classified into Acropora and Pocillopora (dark green bars) and Other (light green bars; right y‐axis) groups for East Bay (EB) and Praslin (P). Averages ± SE are shown (n = 3 for East Bay and n = 6 for Praslin). Symbiodiniaceae cell density for unbleached (dark gray bars) and bleached (light gray bars) colonies of (e) Acropora gemmifera, (f) Acropora muricata, (g) Coelastrea aspera, and (h) Porites lutea at East Bay and Praslin. Asterisks (*) indicate significant differences between health, arrows (^) indicate a significant difference between site for the bleached colonies of A. muricata where p < 0.05. Data were log10 transformed for A. muricata and P. lutea and square‐root transformed for C. aspera for homogeneity of variance. Averages ± SE shown (n = 3, n = 2 for bleached A. muricata at Praslin)
