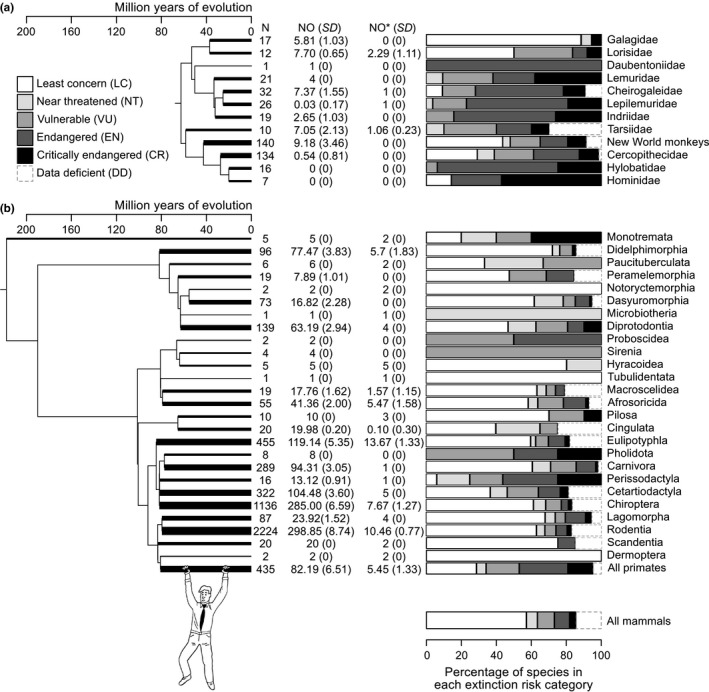
Figure 1.

Illustration of phylogenetic patterns in extinction risks and in the number of species that are more original than Homo sapiens in (a) primates and (b) mammals. We used the Springer et al. tree in (a) and the Rolland et al. tree in (b) to provide partial representations of the primate and mammal phylogeny. In (a), tips of the tree are the primate families except for the paraphyletic New World families (Atelidae, Aotidae, Callitrichidae, Cebidae, Pitheciidae) that we grouped into a single clade. In (b), tips of the tree are the monophyletic mammal orders. Given that we displayed a simplified version of the trees, we used the thickness of the terminal branches in trees to better indicate how many species there are in each family (for primates) or order (for mammals). The thickness is equal to log(1 + N)/log(2)*u, where N is the number of species, and u is the basic thickness when N = 1. Next to each phylogenetic tree, a table gives the number of species in each terminal clade (N) including data‐deficient species (IUCN 2016), the number of species (NO) that were more original than H. sapiens according to index ED in our simulations of missing data effects and its standard deviation over all simulations (SD), the same number of species (NO*) if currently threatened species are driven extinct (vulnerable, endangered and critically endangered species). A bar plot gives the percentage of species in each IUCN category (IUCN 2016)
