
Figure 3.
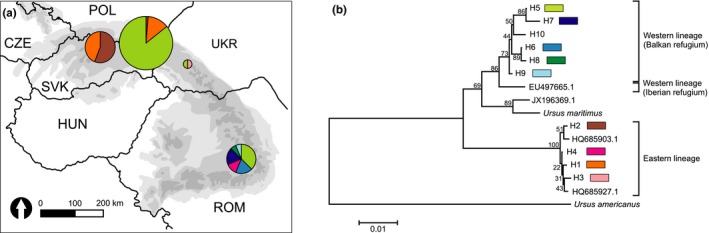
MtDNA haplotype frequencies in studied brown bear populations (a) with respective neighbor‐joining tree based on concatenated mtDNA sequences (b). Size of each diagram is scaled by sample size. Bootstrap support values are given at each node of the tree. The trees have been rooted with sequence of Ursus americanus