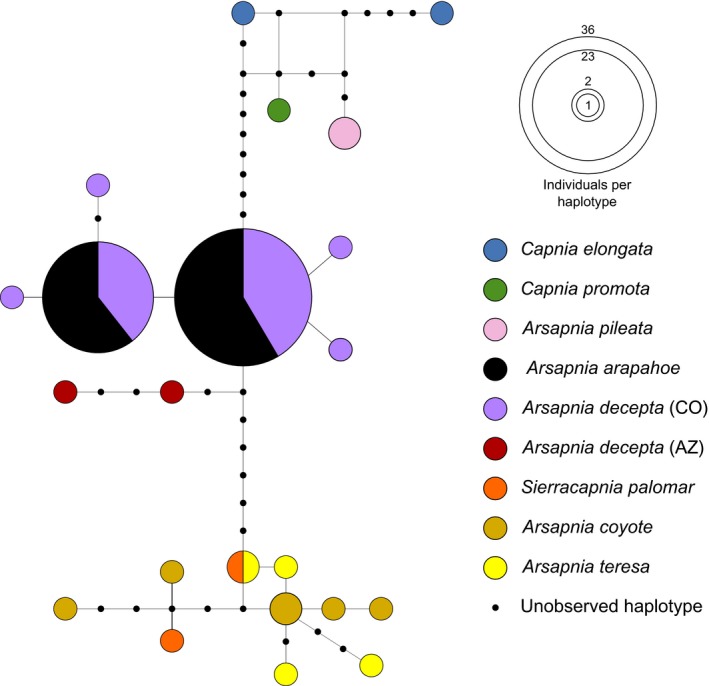
Figure 2.

About 95% maximum parsimony network of cytochrome c oxidase subunit 1 sequences for haplotypes of capniid stoneflies from the clade representing the Arsapnia group. Only those specimens linked to the network containing A. arapahoe (n = 22) are shown. Each circle represents a haplotype, sizes are proportional to the number of individuals with that haplotype, and phenotypes associated with each haplotype are identified by color. Haplotype labels are in Supporting Information Tables S1 and S2. Each line segment represents a single mutation, and small black dots represent unobserved haplotypes. The remaining networks representing the Arsapnia group are in Supporting Information Figure S1
