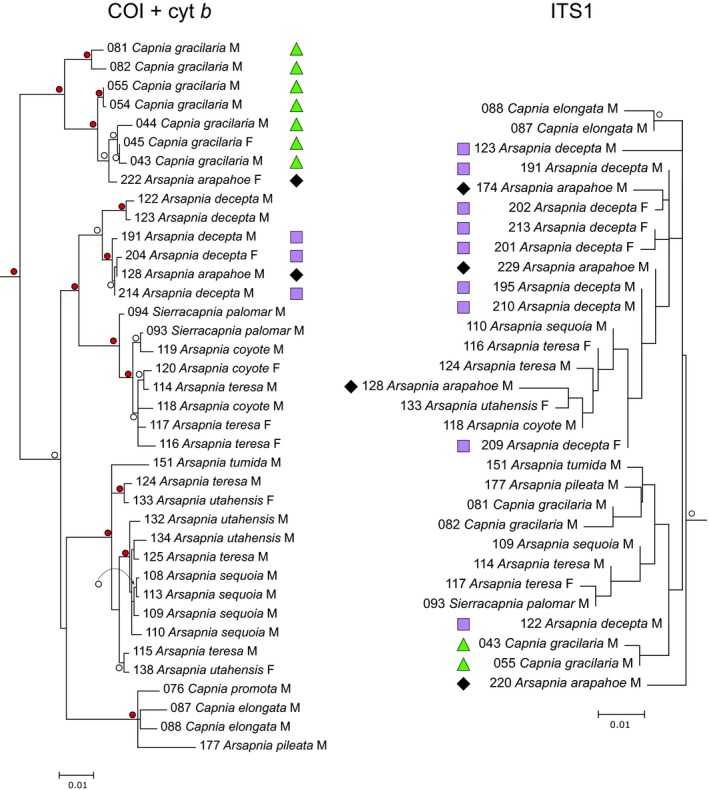
Figure 3.

A portion of the best‐scoring phylogenetic tree inferred from a data‐partitioned maximum‐likelihood analysis (with 1,000 bootstrap replicates) of 91 sequences (1,419 nucleotides) of the concatenated mitochondrial genes cytochrome c oxidase subunit 1 and cytochrome b (COI + cyt b) and of 64 sequences (442 nucleotides and 87 gap‐coded positions) of the nuclear first internal transcribed spacer and adjacent portions of the r18S and r5.8S regions (ITS1). Only that portion of each tree representing the Arsapnia group is displayed. Sex of a specimen is indicated by M (male) or F (female). Symbols highlight specimens phenotypically identified as A. arapahoe (black diamonds), A. decepta (purple squares), or Capnia gracilaria (green triangles) in Colorado. Branches with bootstrap support >70% are labeled (○, bootstrap support 70%–90%;  , bootstrap support >90%). Branch lengths are proportional to the number of substitutions per site. For sequence numbers, see Supporting Information Table S1.
