. 2018 Dec 4;10(6):1741–1745. doi: 10.1039/c8sc04496a

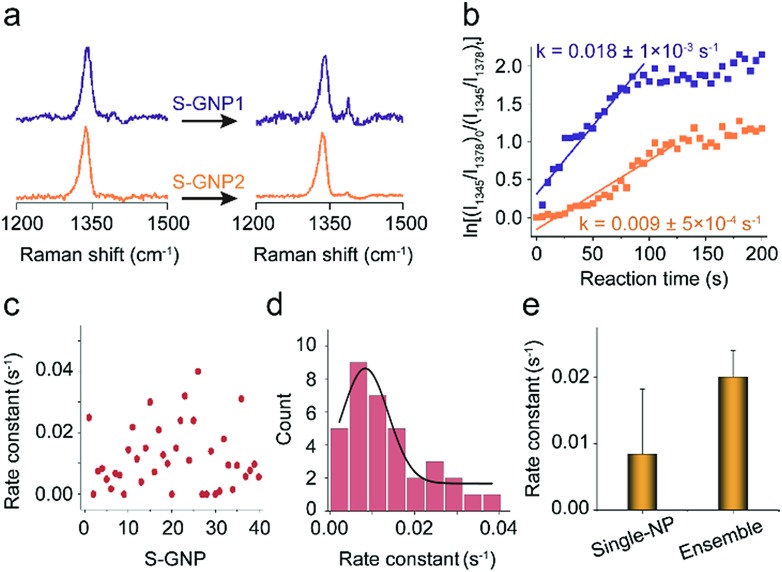
Fig. 3. (a) SERS spectra corresponding to two different catalysts discussed in the main text, S-GNP1 and S-GNP2, before (0 s) and 60 s after the addition of borohydride for a 1 s integration time, taken every 5 s at 638 nm. (b) Plot of ln[(I1345/I1378)0/(I1345/I1378)t] versus time for the determination of the rate constants for the reduction process with the S-GNPs shown in (a). (c) Rate constants obtained from 40 S-GNPs and (d) their statistical distribution. (e) Comparison between the average rate constant obtained from the single nanoparticle measurement with that from the ensemble measurement by assembling the densely packed S-GNPs on the amino functionalized Si wafer.

Fig. 3