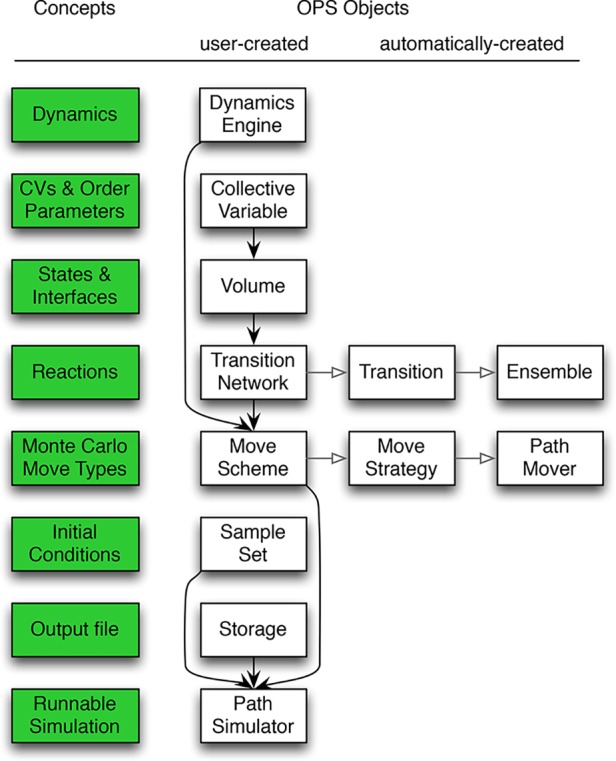
Figure 3.

Schematic representation of the connection between the path sampling concepts and their related OPS objects. The concepts are listed in the leftmost column, shaded green. The next column shows the objects which must be created by a user to run a simulation. The filled arrows indicate when one object is the input to create another object. The objects in the right two columns are automatically created. The open arrows point from an object to the objects it automatically creates. In this way a TransitionNetwork creates a Transition object that creates in turn Ensemble objects.
