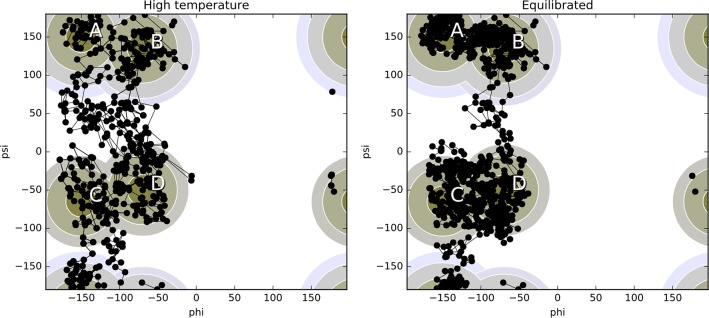
Figure 9.
Comparison between initial sample after generation at high temperature and room temperature equilibration for alanine dipeptide in the psi–phi plane from Section 6.2. The trajectories are plotted as connect dots, where each dot represents a snapshot. The stable state and interface definitions for A, B, C, and D are plotted in the background. Note that after cooling to room temperature the trajectories are sampling a more narrow path samples, as expected.

