Fig. 2.
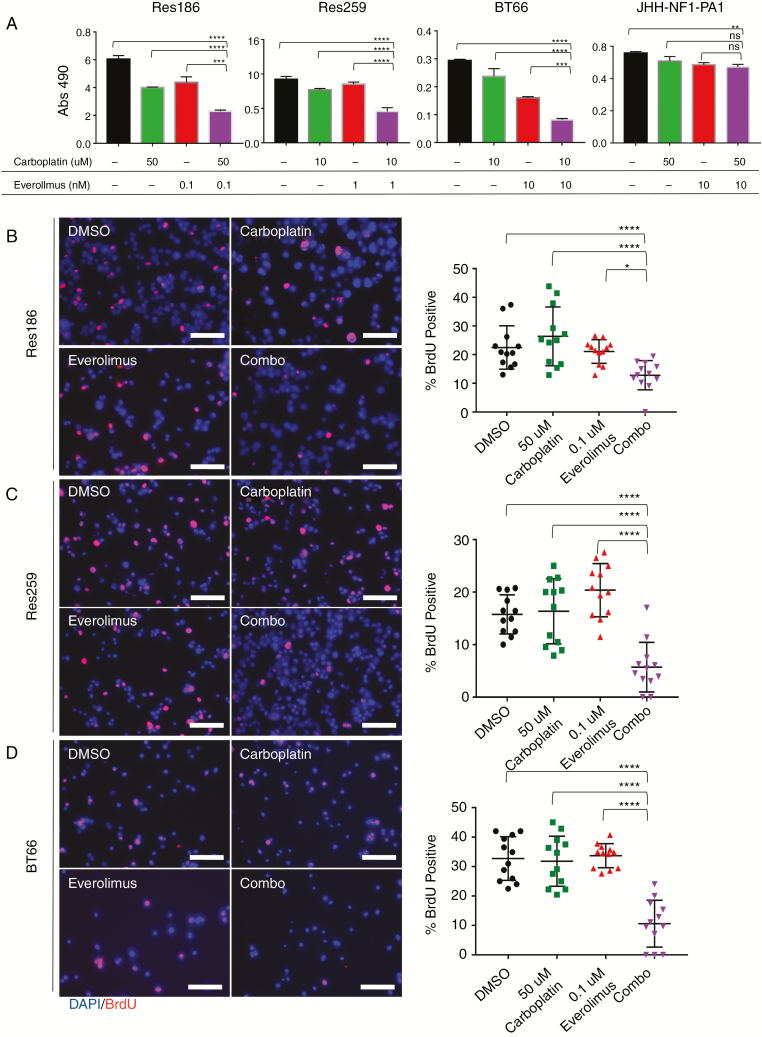
Everolimus synergizes with carboplatin in pLGG lines. (A) MTS assay of carboplatin and everolimus in Res186, Res259, BT66, and JHH-NF1-PA1 cell lines on day 5. Carboplatin concentrations were determined based on IC25 from previous single dose experiments. Error bars represent ±SD; **P < 0.01, ***P < 0.001, ****P < 0.0001 by ANOVA. (B) Left: 200× fluorescent images of Res186 treated with DMSO, 0.1 nM everolimus, 50 μM carboplatin, or combination for 96 hours. Right: quantification of BrdU positive cells. (C) Left: 200× fluorescent images of Res259 treated with DMSO, 1 nM everolimus, 10 μM carboplatin, or combination for 96 hours. (D) Left: 200× fluorescent images of BT66 treated with DMSO, 10 nM everolimus, 10 uM carboplatin, or combination for 96 hours. Stain of 4′,6′-diamidino-2-phenylindole (blue) and BrdU (red). Right: quantification of BrdU. Bars represent ±SD; *P < 0.05, **P < 0.01, ****P < 0.0001 by ANOVA. Experiment was performed in 3 distinct biological replicates. Scale bar is 50 microns.

