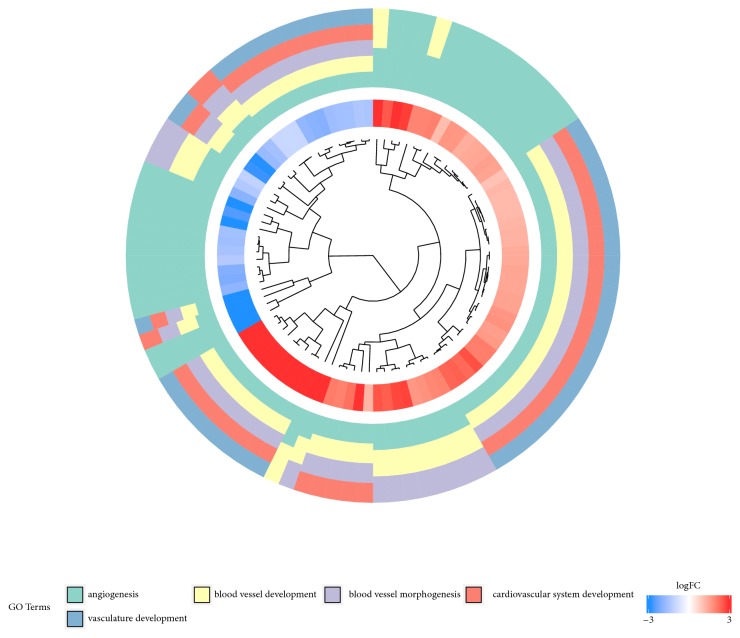
Figure 3.
The Representation of hierarchical clusterization, fold change and assignment of differently expressed genes that belong to chosen “angiogenesis”, “blood vessel development”, “blood vessel morphogenesis”, “cardiovascular system development” and “vasculature development” GO BP terms. Genes are grouped together based on their expression patterns and the clusterization pattern is represented by dendrogram inside the circle. The middle ring represents the logarithm of gene expression fold change of studied genes. The outer ring represents the terms assigned to the genes.

