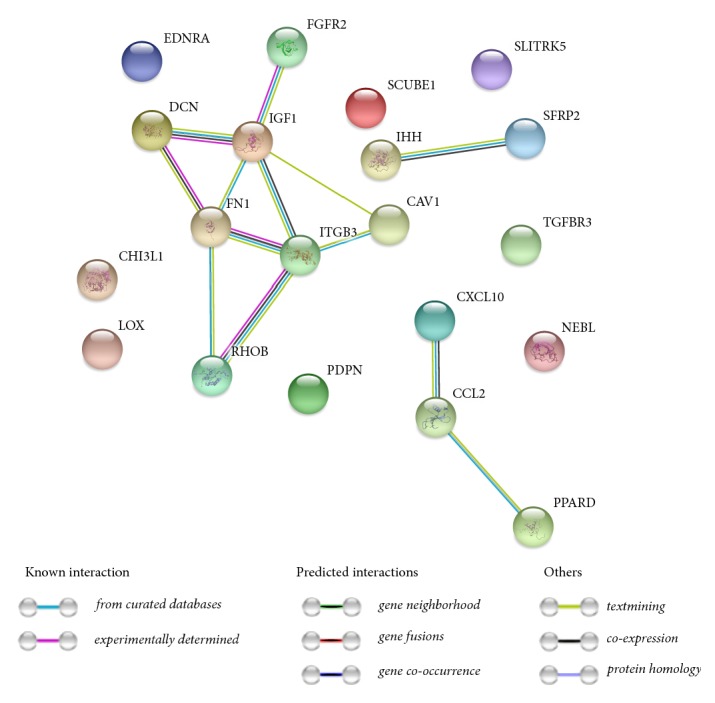
Figure 6.

STRING-generated interaction network among differentially expressed genes belonging to the between 10 most upregulated and 10 most downregulated genes that belong to “angiogenesis”, “blood vessel development”, “blood vessel morphogenesis”, “cardiovascular system development” and “vasculature development” GO BP terms. The intensity of the edges reflects the strength of the interaction score.
